Top 30 Social Network Analysis and Visualization Tools
We review major tools and packages for Social Network Analysis and visualization, which have wide applications including biology, finance, sociology, network theory, and many other domains.
Here is a list of top Social Network Analysis and Visualization Tools we found – see also KDnuggets Social Network Analysis, Link Analysis, and Visualization page.
-
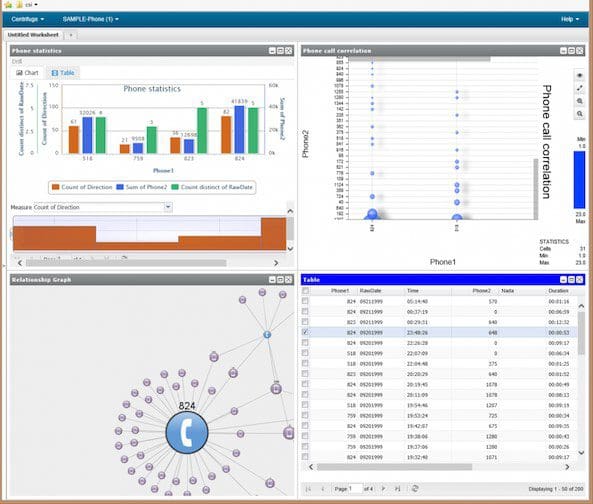
Centrifuge offers analysts and investigators an integrated suite of capabilities that can help them rapidly understand and glean insight from new data sources, visualize discoveries by interacting with data, collaborate to draw conclusions.

-
Commetrix is a Software Framework for Dynamic Network Visualization and Analysis that supports Community Moderators, Members, and Network Researchers. Commetrix is an exploratory analysis tool for dynamic network data. Its connectors can conveniently read all sources of accessible network data, like co-authorship or business process networks. Still, the focus is on analyzing evolving patterns of electronic communication, including e mail, discussions, voice over IP, and instant messaging.
-
Cuttlefish is a network workbench application that visualizes the networks with some of the best known layout algorithms. It allows detailed visualizations of the network data, interactive manipulation of the layout, graph edition and process visualization as well as different input methods and outputs in TeX using Tikz and PSTricks. It can be downloaded as jar archive and can used with Gephi too.
-
Cytoscape is an open source software platform for visualizing molecular interaction networks and biological pathways and integrating these networks with annotations, gene expression profiles and other state data.Although Cytoscape was originally designed for biological research, now it is a general platform for complex network analysis and visualization. Cytoscape core distribution provides a basic set of features for data integration, analysis, and visualization. Additional features are available as Apps (formerly called Plugins). Apps are available for network and molecular profiling analyses, new layouts, additional file format support, scripting, and connection with databases.
-
EgoNet is a program for the collection and analysis of egocentric network data. It helps you create the questionnaire, collect data and provide general global network measures. In addition, data matrices can be used for a more extensive analysis by other software. Once the interview is completed, the network can be immediately visualized, allowing the interviewer to ask further questions about the network. Other utilities include combining personal networks into a single whole network.
-
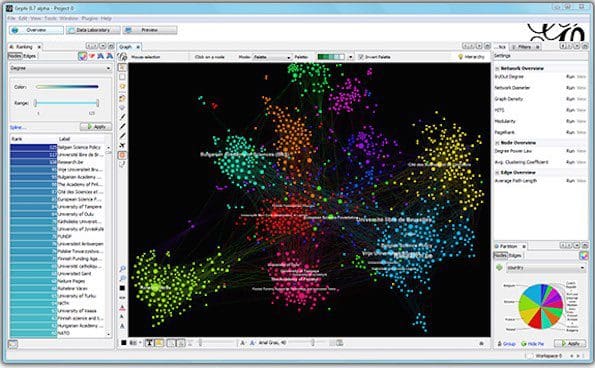
Gephi is an interactive visualization and exploration platform for all kinds of networks and complex systems, dynamic and hierarchical graphs. Runs on Windows, Linux and Mac OS X. Gephi is open-source and free. Gephi is a tool for people that have to explore and understand graphs. Like Photoshop but for data, the user interacts with the representation, manipulate the structures, shapes and colors to reveal hidden properties.
-
Graph-tool is an efficient Python module for manipulation and statistical analysis of graphs (a.k.a. networks). Contrary to most other python modules with similar functionality, the core data structures and algorithms are implemented in C++, making extensive use of template meta-programming, based heavily on the Boost Graph Library. Graph-tool has its own layout algorithms and versatile, interactive drawing routines based on cairo and GTK+, but it can also work as a very comfortable interface to the excellent graphviz package.
-
GraphChi is a spin-off of the GraphLab project (now renamed to Dato) from the Carnegie Mellon University. It is to bring web-scale graph computation, such as analysis of social networks, available to anyone with a modern laptop. It saves you from the hassle and costs of working with a distributed cluster or cloud services. Programs for GraphChi are written in the vertex-centric model, proposed by GraphLab and Google’s Pregel.
-
Graphviz is open source graph visualization software. Graph visualization is a way of representing structural information as diagrams of abstract graphs and networks. The Graphviz layout programs take descriptions of graphs in a simple text language, and make diagrams in useful formats, such as images and SVG for web pages; PDF or Postscript for inclusion in other documents; or display in an interactive graph browser. Graphviz has many useful features for concrete diagrams, such as options for colors, fonts, tabular node layouts, line styles, hyperlinks, and custom shapes.