KDnuggets 15th Annual Analytics, Data Mining, Data Science Software Poll: RapidMiner Continues To Lead
With over 3,000 data miners taking part in KDnuggets 15th Annual Software Poll, RapidMiner continues to lead. Free software is used much more outside US, and Hadoop usage grows fastest in Asia.
The 15th annual KDnuggets Software Poll got huge attention from analytics and data mining community and vendors, attracting over 3,000 voters.
The poll measures both how widely a data mining tool is used, and, given increased popularity of KDnuggets, also how strongly the vendors advocate for their tool. Many vendors have asked their users to vote in this poll, but one vendor has created a special page hardcoded to vote only for their software. In a fair campaign, it is normal to advocate for your candidate, but it not OK to give voters a ballot with only one option. Voters should be able to consider all the choices. The invalid votes from this vendor were removed from the poll, leaving 3,285 valid votes used for this analysis.
We do have advertising from many of the vendors, but those vendors appear in the top, middle, and bottom parts of the poll, and advertising has absolutely no effect on poll results. We are more interested in overall trends that are revealed by this poll - see analysis below.
The average number of tools used was 3.7, significantly higher than 3.0 in 2013.
The separation between commercial and free software continues to shrink. (Note: since RapidMiner has introduced a commercial version relatively recently, we counted RapidMiner as a free software for the analysis below).
This year, 71% of voters used commercial software and 78% used free software. About 22% used only commercial software, down from 29% in 2013 (part of the changes was probably due to confusion between votes for RapidMiner commercial and free versions in 2013). About 28.5% used free-software only, slightly down from 30% in 2013. 49% used both free and commercial software, up from 41% in 2013.
About 17.5% of voters report using Hadoop or other Big data tools, a measurable increase from 14% in 2013 (was 15% in 2012, 3% in 2011).
This suggests that Big Data usage is growing slowly, and still is primarily the domain of a select group of analysts in web giants, government agencies, and very large enterprises. Most data analysis is still done on "medium" and small data.
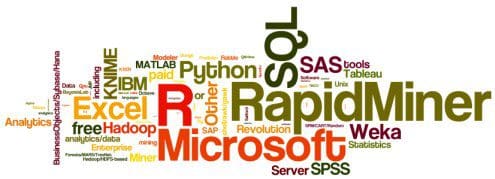
The following word cloud represents the votes for tools.
 The top 10 tools by share of users were
- RapidMiner, 44.2% share ( 39.2% in 2013)
- R, 38.5% ( 37.4% in 2013)
- Excel, 25.8% ( 28.0% in 2013)
- SQL, 25.3% ( na in 2013)
- Python, 19.5% ( 13.3% in 2013)
- Weka, 17.0% ( 14.3% in 2013)
- KNIME, 15.0% ( 5.9% in 2013)
- Hadoop, 12.7% ( 9.3% in 2013)
- SAS base, 10.9% ( 10.7% in 2013)
- Microsoft SQL Server, 10.5% (7.0% in 2013)
Among tools with at least 2% share, the highest increase in 2014 was for
- Alteryx, 1079% up, to 3.1% share in 2014, from 0.3% in 2013
- SAP (including BusinessObjects/Sybase/Hana), 377% up, to 6.8% from 1.4%
- BayesiaLab, 310% up, to 4.1% from 1.0%
- KNIME, 156% up, to 15.0% from 5.9%
- Oracle Data Miner, 117% up in 2014, to 2.2% from 1.0%
- KXEN (now part of SAP), 104% up, to 3.8% from 1.9%
- Revolution Analytics R, 102% up, to 9.1% from 4.5%
- TIBCO Spotfire, up 100%, to 2.8%, from 1.4%
- Salford SPM/CART/Random Forests/MARS/TreeNet, up 61%, to 3.6% from 2.2%
- Microsoft SQL Server, up 50%, to 10.5% from 7.0%
Revolution Analytics, Salford Systems, and Microsoft SQL server have showed strong increases for 2 years in the row.
The growing analytics market was also reflected in more tools (over 70).
New analytics tools (not counting languages like Perl or SQL) that received at least 1% share in 2014 were
- Pig 3.5%
- Alpine Data Labs, 2.7%
- Pentaho, 2.6%
- Spark, 2.6%
- Mahout, 2.5%
- MLlib, 1.0%
Among tools with at least 2% share, the largest decline in 2014 was for
- StatSoft Statistica (now part of Dell), down 81%, to 1.7% share in 2014, from 9.0% in 2013 (partly due to lack of campaigning for Statistica, now that it is part of Dell)
- Stata, down 32%, to 1.4% from 2.1%
- IBM Cognos, down 24%, to 1.8% from 2.4%
- MATLAB, down 15%, to 8.4% from 9.9%
Statistica share has now declined for 2 years in a row (was 14% in 2012). With the recent acquisition by Dell, it seems likely that Statistica will continue to lose market and mind share.
The following table shows results of the poll, with Tool (User-votes), % alone.
% alone is the percent of tool voters used only that tool alone. For example, just 0.9% of Python users have used only Python, while 35.1% of RapidMiner users indicated they used that tool alone.
|
What Analytics, Big Data, Data mining, Data Science software you used in the past 12 months for a real project? [3285 voters] | |
| Legend:
Red: Free/Open Source tools
Green: Commercial tools Fuchsia: Hadoop-related tools |
na - not included in poll in 2013. |
| RapidMiner (1453), 35.1% alone | |
| R (1264), 2.1% alone | |
| Excel (847), 0.1% alone | |
| SQL (832), 0.1% alone | na |
| Python (639), 0.9% alone | |
| Weka (558), 0.4% alone | |
| KNIME (492), 10.6% alone | |
| Hadoop (416), 0% alone | |
| SAS base (357), 0% alone | |
| Microsoft SQL Server (344), 0% alone | |
| Revolution Analytics R (300), 13.3% alone | |
| Tableau (298), 1.3% alone | |
| MATLAB (277), 0% alone | |
| IBM SPSS Statistics (253), 0.4% alone | |
| SAS Enterprise Miner (235), 1.3% alone | |
| SAP (including BusinessObjects/Sybase/Hana) (225), 0% alone | |
| Unix shell/awk/gawk (190), 0% alone | na |
| IBM SPSS Modeler (187), 3.2% alone | |
| Other free analytics/data mining tools (168), 1.8% alone | |
| Rattle (161), 0% alone | |
| BayesiaLab (136), 23.5% alone | |
| Other Hadoop/HDFS-based tools (129), 0% alone | na |
| Gnu Octave (128), 0% alone | |
| JMP (125), 3.2% alone | |
| KXEN (now part of SAP) (125), 0% alone | |
| Predixion Software (122), 47.5% alone | |
| Salford SPM/CART/Random Forests/MARS/TreeNet (118), 31.4% alone | |
| Pig (116), 0% alone | na |
| Orange (112), 0% alone | |
| Alteryx (103), 50.5% alone | |
| Perl (100), 2.0% alone | na |
| Other languages for analytics (98), 0% alone | na |
| QlikView (97), 1.0% alone | |
| TIBCO Spotfire (91), 25.3% alone | |
| Alpine Data Labs (88), 52.3% alone | na |
| Pentaho (87), 0% alone | na |
| Spark (87), 0% alone | na |
| Mahout (81), 0% alone | na |
| Mathematica (74), 0% alone | |
| Oracle Data Miner (72), 5.6% alone | |
| Other paid analytics/data mining/data science software (62), 0% alone | |
| IBM Cognos (60), 0% alone | |
| StatSoft Statistica (now part of Dell) (56), 14.3% alone | |
| C4.5/C5.0/See5 (49), 0% alone | |
| Stata (46), 0% alone | |
| XLSTAT (38), 0% alone | |
| MLlib (33), 0% alone | na |
| Graphlab (29), 0% alone | na |
| BigML (28), 14.3% alone | na |
| Miner3D (28), 14.3% alone | |
| Julia (27), 0% alone | na |
| Datameer (26), 34.6% alone | na |
| Zementis (26), 15.4% alone | |
| Splunk/ Hunk (24), 0% alone | na |
| F# (17), 5.9% alone | |
| Clojure (16), 0% alone | na |
| Actian (15), 0% alone | na |
| RapidInsight/Veera (15), 0% alone | |
| Angoss (13), 0% alone | |
| Lisp (10), 0% alone | na |
| Lavastorm (9), 0% alone | |
| WPS: World Programming System (8), 0% alone | na |
| FICO Model Builder (7), 0% alone | na |
| WordStat (7), 0% alone | |
| 0xdata and H2O (5), 0% alone | na |
| SciDB from Paradigm4 (5), 0% alone | na |
| Megaputer Polyanalyst/TextAnalyst (4), 0% alone | |
| SiSense (4), 50.0% alone | na |
| GoodData (3), 0% alone | na |
Additional tools not in this poll but mentioned in comments were
- Frontline Systems XLMiner (Data Mining for Excel) and Solver (optimization), www.solver.com/products-overview
- OmniScope, which integrates 'round trip' with R enabling munging etc to be done by anyone in Omniscope, www.visokio.com/download
- DataDetective (Data mining combined with a Mapinfo / ArcGis GIS and I2 Analyst's Notebook)
- Oracle R Enterprise
- Vowpal Wabbit, hunch.net/~vw/
- VISUAL PROCESS, www.visual-process.com
The following table shows breakdown by region and tool type: commercial/free/both. There were only about 12 people who only used Hadoop tools, and they are excluded from analysis below.
While the share of analysts who used both free and commercial tools was about 50% in all regions, US was the only region where more data miners used only commercial tools than only free tools (2/1 ratio). In Europe, Asia, and Latin America, the ratio was reversed, with 2-4 times as many data miners using only free tools vs only commercial tools.
| Region, Avg N tools | |
|---|---|
| US/Canada (39%), 3.8 | 


33% 17% 49% |
| Europe (36%), 3.5 |
14% 38% 47% |
| Asia (12%), 4.2 | 15% 31% 53% |
| Latin America (6.1%), 3.8 | 8.5% 39% 53% |
| Africa/MidEast (3.2%), 3.6 | 12% 40% 48% |
| Australia/NZ (3.0%), 4.2 | 23% 19% 58% |
We also examined the use of Hadoop-related tools (including Spark) across regions, and note that Hadoop usage growth fastest outside US, especially in Asia.
| Region | % using Hadoop-related tools in 2014 |
% using Hadoop-related tools in 2013 |
|---|---|---|
| US/Canada | 18% | 17% |
| Europe | 13% | 12% |
| Asia | 31% | 19% |
| Latin America | 16% | 8% |
| Africa/MidEast | 17% | 11% |
| Australia/NZ | 12% | 9% |
| All | 18% | 14% |
Here is additional analysis of KDnuggets Software Poll, including how to download anonymized poll data.
Related:
- KDnuggets 2013 Software Poll: RapidMiner and R vie for first place.
- KDnuggets 2012 Poll: Analytics, Data mining, Big Data software used
- KDnuggets 2011 Poll: Data Mining/Analytic Tools Used
- KDnuggets 2010 Poll: Data Mining / Analytic Tools Used
- KDnuggets 2009 Poll: Data Mining Tools Used
- KDnuggets 2008 Poll: Data Mining Software Used
- KDnuggets 2007 Poll: Data Mining/Analytics Software Tools