Taming the Internet of Things – KNIME Case Study
With increasing interest in the Internet of Things (IoT), see how KNIME can be applied to collect data from IoT sensors, enrich that data, transform it, analyze it, and finally visualize it.
by Rosaria Silipo, Sept 2014.
There has been a lot of talk about the Internet of Things lately, especially since the purchase of Nest by Google, officially opening the run towards intelligent household systems. Companies working in this field have multiplied over the last few years, like SmartThings, later acquired by Samsung . However, it is not only households that can be intelligently interconnected: cities – i.e. smart cities – represent another area for the application of the Internet of Things. One of the first smart cities around the world has been Santander in the north of Spain (www.smartsantander.eu). Sensors have been installed around the city to constantly monitor temperature, traffic, weather conditions, and parking facilities.
The Internet of Things poses a great challenge for data analysts, on the one hand because of the very large amounts of data created over time and on the other because of the algorithms that make the sensor-equipped object (house, or city) capable of learning and therefore smarter.
We decided to take up this challenge and put KNIME (www.knime.org) to work to:
As an example of an Internet of Things application, we need a use case that is easy for everybody to understand and with publicly available data to reproduce. After some search, we found a bike share system in Washington DC called Capital Bikeshare (www.capitalbikeshare.com)

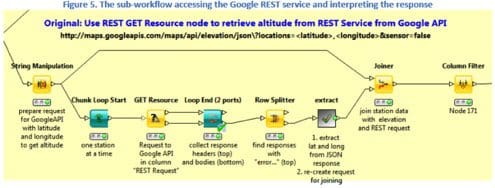
Here is an example of sub-workflow that submits the requests to the Google API RESTful service is shown in Figure 5 below. This sub-workflow consists of two parts: a loop posting a request and collecting the response for each data row and a metanode, named “extract”, also containing a loop to interpret all received responses
 The results of this work, together with white paper, data, and workflows, have been made available in the KNIME white papers pool at http://www.knime.com/white-papers#IoT.
In this kind of cutting edge problems, where a very large amount of data is generated, it is imperative to adopt a scalable approach that can grow together with the application. A scalable approach means not only handling bigger data faster, but also reaching out to new external data sources, integrating different complementary tools to refine the analytics with the newest emerging algorithms and techniques, and collaborating within the analyst team to exploit the group’s collective competence. Only an open architecture can provide such a flexible environment, to expand and adapt the tool bench in unpredictable ways (http://www.knime.org/open-for-innovation).
The Internet of Things is a very good example of the data explosion that is occurring in most fields, from social media to sensor-driven processes. But how much information can more data actually convey? This is of course highly dependable on the amount of intelligence we apply to it. Pure data plumbing and systematization do not generally produce more intelligent applications. Only the injection of data analytics algorithms from statistics and machine learning, can make applications capable of learning and therefore ‒ smarter.
Bio: Rosaria Silipo has been a researcher in applications of Data Mining and Machine Learning for over a decade. Application fields include biomedical systems and data analysis, financial time series (including risk analysis), and automatic speech processing.
Related:
There has been a lot of talk about the Internet of Things lately, especially since the purchase of Nest by Google, officially opening the run towards intelligent household systems. Companies working in this field have multiplied over the last few years, like SmartThings, later acquired by Samsung . However, it is not only households that can be intelligently interconnected: cities – i.e. smart cities – represent another area for the application of the Internet of Things. One of the first smart cities around the world has been Santander in the north of Spain (www.smartsantander.eu). Sensors have been installed around the city to constantly monitor temperature, traffic, weather conditions, and parking facilities.
The Internet of Things poses a great challenge for data analysts, on the one hand because of the very large amounts of data created over time and on the other because of the algorithms that make the sensor-equipped object (house, or city) capable of learning and therefore smarter.
We decided to take up this challenge and put KNIME (www.knime.org) to work to:
- collect the large amount of data generated by the Internet of Things sensors;
- enrich the original data with responses from external RESTful services;
- transform the data into a more meaningful set of input features;
- apply time series analysis to add some intelligence into the system;
- optimize the smarter system to get the best performances with the leanest feature set;
- integrate a number of different visualization tools, from R graphic libraries to Open Street Maps and network graphs, into our KNIME workflow.
As an example of an Internet of Things application, we need a use case that is easy for everybody to understand and with publicly available data to reproduce. After some search, we found a bike share system in Washington DC called Capital Bikeshare (www.capitalbikeshare.com)

Here is an example of sub-workflow that submits the requests to the Google API RESTful service is shown in Figure 5 below. This sub-workflow consists of two parts: a loop posting a request and collecting the response for each data row and a metanode, named “extract”, also containing a loop to interpret all received responses
 The results of this work, together with white paper, data, and workflows, have been made available in the KNIME white papers pool at http://www.knime.com/white-papers#IoT.
In this kind of cutting edge problems, where a very large amount of data is generated, it is imperative to adopt a scalable approach that can grow together with the application. A scalable approach means not only handling bigger data faster, but also reaching out to new external data sources, integrating different complementary tools to refine the analytics with the newest emerging algorithms and techniques, and collaborating within the analyst team to exploit the group’s collective competence. Only an open architecture can provide such a flexible environment, to expand and adapt the tool bench in unpredictable ways (http://www.knime.org/open-for-innovation).
The Internet of Things is a very good example of the data explosion that is occurring in most fields, from social media to sensor-driven processes. But how much information can more data actually convey? This is of course highly dependable on the amount of intelligence we apply to it. Pure data plumbing and systematization do not generally produce more intelligent applications. Only the injection of data analytics algorithms from statistics and machine learning, can make applications capable of learning and therefore ‒ smarter.
Bio: Rosaria Silipo has been a researcher in applications of Data Mining and Machine Learning for over a decade. Application fields include biomedical systems and data analysis, financial time series (including risk analysis), and automatic speech processing.
Related: