Interview: David Kasik, Boeing on How Visual Analytics is Improving Aviation Safety
We discuss data visualization at Boeing, the importance of Visual Analytics, Aviation Safety improvement through Analytics and augmented reality.
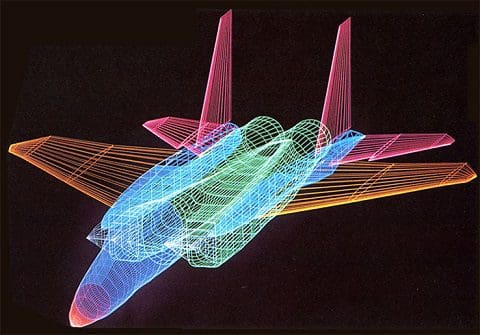
 David Kasik is Boeing's Senior Technical Fellow in visualization and interactive techniques. He is pursuing new ways of using visualization for huge amounts of both geometric and non-geometric data.His work with geometric data made Dave a pioneer in interactive 3D computer graphics. He devoted his first 11 years at Boeing to research and development of computer-aided design software. These projects led to pioneering work in interactive 3D graphics, user interface management systems, and industrial use of non-uniform rational (NURBS) solids and surfaces. Dave is pioneering the use of visual analytics to help extract more information from complex non-geometric data.
He earned his Masters in Computer Science from the University of Colorado in 1972 and a Bachelor’s in Quantitative Studies from the Johns Hopkins University in 1970. He participates in numerous professional organizations, including ACM (Association for Computing Machinery), which named Dave a Distinguished Scientist in 2007 and a Fellow in 2013; ACM SIGGRAPH, where he started the annual Pioneers student mentoring program and received the Outstanding Service Award in 2012.
Here is my interview with him:
Anmol Rajpurohit: Q1. What role does visualization play at Boeing? What are the typical visualization problems that you work on?
David Kasik: Visualization has been part of the Boeing fabric since the company was founded in 1916.
Computer-based visualization through computer graphics started in Boeing in 1960. Verne Hudson coined the term, which Bill Fetter entered into computer jargon.
Recently, the importance of visualization has expanded beyond its traditional role in engineering. The Boeing factory and customer support rely on an expanded set of new capabilities and insights for problem-solving and decision-making.
My personal work involves computer-based visualization for both non-geometric data (through visual analytics) and geometric data (through 3D massive model visualization and model-based design). The problems I address vary all over the map. The dominant cross-project thread for me is spent working on interactive scalability and performance.
AR: Q2. How do you define Visual Analytics? Why is it so important?
DK: Visual analytics has a formal definition: the science of analytical reasoning facilitated by interactive visual interfaces. (Ref: Illuminating the Path, http://vis.pnnl.gov/pdf/RD_Agenda_VisualAnalytics.pdf)
 In simpler terms, visual analytics allows a person to gain better business insight by interactively exploring pictures of geometric or non-geometric data. That insight can range from providing easy access to different data sources to discovery of unexpected results.
Inevitably, the issue is to help people better cope with the immense amount of computer-based data already in existence. Since data volume continues to grow exponentially, people need a wide path to the brain. A person’s eyes are his or her most efficient sensory input device. In quantitative terms, our visual system sends over 80% of all incoming data to the brain for processing.
AR: Q3. You have been involved in computer graphics since 1969. How do you see the evolution of visualization and interactive techniques over the last few decades?
DK: What attracted me to computer graphics in the first place was the ability to tell stories visually.
Fundamentally, this role of storytelling, understanding, and explaining is the same today. The computer graphics tools we have are amazingly richer and handle much more data. The fundamental human problem—how to tell a meaningful story—still exists.
AR: Q4. How does Analytics enable proactive maintenance of aircrafts? How else does Analytics help improve aviation safety?
DK: Boeing has an ever-increasing number of examples of effective use of analytics. Analytics is helping reduce turn times for both military and commercial aircraft. Sensor feeds are interpreted from in-flight data sensors to understand where a possible problem can be
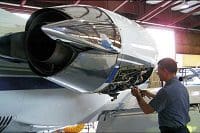 prevented by early part replacement. Analytics is growing as part of the manufacturing process, too. For example, we’re replacing out-of-tolerance tools before they fail.
One of our critical tasks is to insure safety both for the flying public and for our own workforce. Analytics is in active use to help design better locations and increase crew responsiveness to bird strikes. We’re helping industrial safety by finding assembly tasks that cause repetitive stress injuries so that the tasks can be redesigned.
AR: Q5. What are your thoughts on the current state of Augmented Reality technology and its applications? When do you expect it to become mainstream? Can it help with data visualization?
DK: Personally, I love augmented reality. Boeing (through Tom Caudell and David Mizell) coined the term in 1990.
In many ways, augmented reality has not penetrated the industrial workplace much as yet.
 Getting AR into the mainstream requires integrating the technology with the overall production computing system. The big technical hurdle is providing registration accuracy for totally mobile devices. Today’s accurate systems require a fixed base. In addition, dealing with visual scale, something we can do with notebooks and laptops is not quite there for lightweight, highly mobile devices. I expect significant progress over the next five years.
The 30-year evolution is pretty normal for complex computing technology to make a real dent into Boeing’s complex business.
Second part of the interview will be published soon.
Related: