You have created your first Linear Regression Model. Have you validated the assumptions?
Linear Regression is an excellent starting point for Machine Learning, but it is a common mistake to focus just on the p-values and R-Squared values while determining validity of model. Here we examine the underlying assumptions of a Linear Regression, which need to be validated before applying the model.
By Sudipto Dasgupta, Flipkart.
With the dawn of the age of Data Science, there is an increased interest in learning and applying algorithms, not just by business analysts or data scientists, but by several other professionals whose core job may not be crunching data or building models. Good sign, indeed, if one understands the when, why and how of applying these fantastic techniques.
A Linear Regression Model works under certain assumptions, which are:
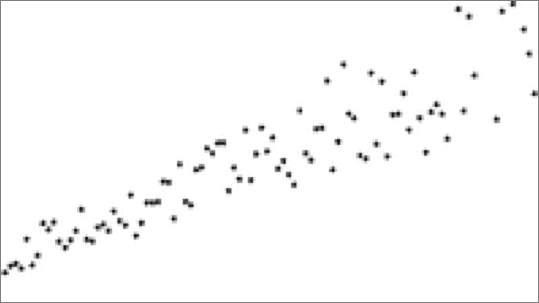
1. Linear relationship between the Y (DV) and X’s (IV). If your scatterplot shows curvilinear relationship, keep in mind that higher order polynomials (2 or above) may do a better job at modelling the data. Compare models, statistics and decide for yourself which model best explains your data.
2. Multicollinearity – the absence of it. For validity of a LR model, the VIF (Variance Inflationary Factor) should not be too high. How high is too high? Well, usually a VIF of 5 is used as threshold. Some even use a 2.5. You can do your own research on this, but almost always a VIF as high as 10 is way too high. A high VIF indicates presence of multicollinearity, that is, high correlation between IVs. You can test your model by removing one or more correlated IVs and re-running the model. You can also use other dimension reduction techniques such as PCA (Principal Component Analysis).
3. Homoscedasticity – Homo means similar and scedasticity means distribution of error terms. Thus, homoscedasticity means that the error terms are similarly (read randomly) distributed. If there is any non-random behaviour in the error terms, such as in the residual Vs fit plot below, then the model is said to be suffering from an ailment called Heteroscedasticity. This can also be detected by the methods such as the ncv test. Transformation of variables using methods such as Box-Cox, or trying out different variables altogether can resolve this issue in a model.
4. Residual Normality– The error terms are also called residuals. This is the difference between observed value of the DV(y) and the predicted value (ŷ). The error term is something that keeps us from perfect prediction. Remember that in calculating standard deviation we use {x-x̄}, and in Chi-Square tests we use the {Observed- Expected} value in calculations. Residual analysis is an integral part of several statistical methods, including LR. The assumption for LR is that the residuals must be independent and randomly distributed with a mean of zero, which technically means that the residuals should pass the normality test. This can be tested by extracting the residuals and subjecting to normality tests such as Anderson-Darling Test or Shapiro test, or graphically, with the help of a quantile plot or probability plot. Presence of non-random behaviour indicates that there is some adjustment that needs to be made to the model. Outliers could be the culprit, or that higher order terms are required. Transformations can also come handy in some cases.
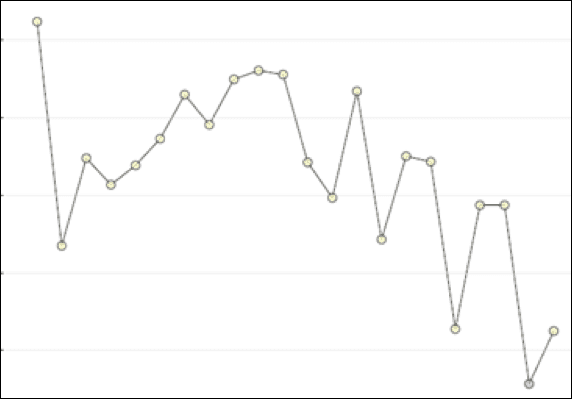
5. Autocorrelation – should not be present. In the previous point, I have stated that residuals must be Independent and normally distributed. When the independence of residuals is violated, we can see patterns such as the one below, or cyclical trends upwards or downwards for a residuals Vs order plot. This can also be detected by applying a Durbin-Watson test on the data. Solutions, again, can be of several types such as using a different model or transforming some of the variables.
Simple Linear Regression, as the name suggests, is easy to understand and easy to apply. There are several cases, that I have found in my projects, that Linear Regression works quite well in modelling the data. It comes as no surprise that Linear Regression is still one of the most commonly used algorithms for data modelling.
Bio: Sudipto Dasgupta is currently working as a Specialist – Process Design for Flipkart India Pvt. Ltd., the largest e-commerce organization in India. He has 15+ years of experience in Business Analytics in domains such as software, market research, education and supply chain. He is an experienced Six Sigma Master Black Belt and project management professional (PMP) with an educational background in Mathematics and Statistics. He has an active interest in the Data Sciences.
Related: