The Executive Guide to Data Science and Machine Learning
This article provides a short introductory guide for executives curious about data science or commonly used terms they may encounter when working with their data team. It may also be of interest to other business professionals who are collaborating with data teams or trying to learn data science within their unit.
Big data. Deep learning. Predictive analytics. A lot of jargon is thrown around within data science departments and in the leading business news sites these days, and there’s a big hiring scramble across industries to develop advanced analytics to aid in decision-making. But what is important to know as an executive?
While data science and the data economy are rapidly emerging and evolving fields, much of the work and new developments related to these fields fall into a few general principles and concepts. This guide aims to provide a short overview of key data-related topics and terms commonly used in data science today along with examples of how they are used in data science.
Big data is a catch-all term for data that is large enough to cause issues in storage and analysis, marked by high volumes (lots of records), high degree of variety (text data, video data, and numerical data together), velocity (streaming data), and veracity (quality of data). Many times, this refers to the number of records, which can be in the billions or trillions, such as transaction data with retail or lead data within large marketing campaigns. Storage becomes an issue with this type of data. However, big data can also refer to data that has a lot of information about a given record, such as genomics data on a patient or academic records of a given student, and this type of data can be very tricky to analyze through statistics, as it violates many assumptions of analysis tools. Data may be large but contain quality control issues, such as missing data, corrupted records, or incorrect capture strategy; this is one of the most common reasons analytics projects fail and a key reason why data capture strategy is so important. Data engineers work with capturing and optimally storing data for future use in analyses or reporting.

Hadoop and SQL are two common databases for data storage (where the data “lives” while it awaits analysis). SQL is common in established businesses and businesses that don’t have high volumes of data; Hadoop is preferred when dealing with very large datasets. Other databases exist, but they are generally unique to a certain industry. MapReduce is a related framework that helps manage and analyze large volumes of data by chopping up the data and storing or analyzing those parts. In this way, a set of computers can work on an analysis or store similar data without needing a large storage space on any given computer. Data and results stored across computers can then be pooled together as needed for a final result. It is common within Hadoop and specialized big data databases/analysis tools.
Artificial intelligence (AI) is a broad field of computer science that includes design of software systems and algorithms to help computers understand speech, represent knowledge, train robots to navigate, reason through problems, and understand images or videos. Generally, there is a goal and data upon which to train the software or optimize the software towards that goal. Algorithms are a set of instruction to a computer guiding this learning process or decision-making, usually based on data and optimizing the instructions based on that data.
Statistical modeling and machine learning are related to AI and algorithms through their overlap with mathematics and statistics. Models statistically test relationships between an outcome of interest (such as customer churn, leads acquired in a marketing campaign, or weekly sales) and a set of predictors (such as customer demographics, buying patterns, click behavior, or other characteristics known about leads or customers that might be related to a given outcome). Many times, these models can also be used to predict future behavior given the important predictors found by the model. Machine learning extends many common statistical models to accommodate big data, and it also includes tools to explore the data outside of prediction, which can be used to segment customer bases or group sales trends over time. Common software languages for implementing such models are R and Python, and the professionals who use these advanced tools to investigate business problems are generally titled data scientists, with data science referring to the work they do to understand business problems, create predictive models, or test new operating procedures/marketing campaigns.
Supervised learning algorithms include machine learning models that learn relationships between outcomes and predictors, with the goal of either understanding drivers of a given outcome or simply predicting future outcomes given a set of predictors. One of the downsides of supervised learning is that outcomes must be observed and that a sufficient amount of data exists upon which to train the model. Classification models are supervised learning algorithms used to understand how groups differ from each other; an example is creating a model to understand how buyer ad click behavior and non-buyer ad click behavior differ. Regression models (within supervised learning) deal with continuous or count outcomes, such as modeling drivers of purchase quantity or service utilization within a given month. Unsupervised learning algorithms explore the data to understand how predictors or outcomes can be grouped, similar to marketing segmentation or visual exploration of data trends.
Deep learning is a type of artificial neural network similar to simple circuits within a brain, a type of supervised learning algorithm commonly used in predictive modeling which works very well on data with lots of records. Unlike other models that plateau in performance within a few thousand training records, deep learning models continue to improve as they are given more and more training data. However, it takes a lot of data to reach good performance with deep learning, and training samples of 5,000 or 10,000 records may not be sufficient for training this type of supervised learning algorithm. Oftentimes, deep learning requires substantial expertise to customize or build from scratch, and it’s helpful to hire an expert in deep learning if the problem or data is complicated or small in size.

Random forest is another supervised learning algorithm that is quite common in practice today. This algorithm performs well for both classification and regression models, and it is well-suited to big data through the map reduce framework. At its core, this method includes a set of models built on samples of data, which are aggregated together into a final model. This helps reduce errors and incorrectly-learned relationships within the set of individual models.
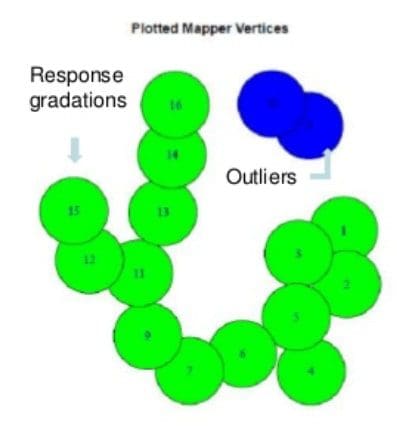
Topological data analysis is a relatively new set of tools, mainly used for unsupervised learning, that have good properties with respect to small data samples, large numbers of predictors, missing data, and errors in data capture. The tools also come with helpful visualization methods that can simplify results and allow data teams to explore the findings further (shown below to highlight records that don’t fit in with other records). This makes them an ideal choice for unsupervised learning, and they are common in industry like biotech, healthcare, and education.

No matter what the technique used, there are a few caveats to any analysis related to the data used to train the models. Sampling and bias are two important consideration when selecting data for use in statistical modeling or machine learning. If only data from customers in New England are selected for an analysis, the results of a model may not generalize to customers in Georgia or Texas; this is an example of bias in the analysis. Sampling methods are important to reduce possible bias, as well as address several statistical issues that can lead to bad results. Overpowering an analysis, in which too much data is used to test group differences or look for relationships in the data, can suggest relationships that don’t actually exist, as the model is finding tiny fluctuations within a given predictor rather than a true relationship. This is very important in A/B testing of marketing campaigns.
Several excellent books go into more detail than this guide, and readers wishing to dive further into data science for executives can learn more from these selected resources:
Executive Data Science (by Roger Peng)
Big Data at Work: Dispelling the Myths, Uncovering the Opportunities (by Thomas Davenport)
Keeping Up with the Quants: Your Guide to Understanding and Using Analytics (by Thomas Davenport and Jihno Kim)
Related:
- How does business intelligence & data analytics drive business value?
- Data Exchange and Marketplace, a New Business Model in Making
- Best Practices for Scaling Data Science Across the Organization
