 How to build a data science project from scratch
 How to build a data science project from scratch
A demonstration using an analysis of Berlin rental prices, covering how to extract data from the web and clean it, gaining deeper insights, engineering of features using external APIs, and more.
By Jekaterina Kokatjuhha, Research Engineer at Zalando.
There are many online courses about data science and machine learning that will guide you through a theory and provide you with some code examples and an analysis of very clean data.
However, in order to start practising data science, it is better if you challenge a real-life problem. Digging into the data in order to find deeper insights. Carrying out feature engineering using additional sources of data and building stand-alone machine learning pipelines.
This blogpost will guide you through the main steps of building a data science project from scratch. It is based on a real-life problem — what are the main drivers of rental prices in Berlin? It will provide an analysis of this situation. It will also highlight the common mistake beginners tend to make when it comes to machine learning.
These are the steps that will be discussed in detail:
- finding a topic
- extracting data from the web and cleaning it
- gaining deeper insights
- engineering of features using external APIs

Finding a topic
There are many problems that can be solved by analyzing data, but it is always better to find a problem that you are interested in and that will motivate you. While searching for a topic, you should definitely concentrate on your preferences and interests.
For instance, if you are interested in healthcare systems, there are many angles from which you could challenge the data provided on that topic. “Exploring the ChestXray14 dataset: problems” is an example of how to question the quality of medical data. Another example — if you are interested in music, you could try to predict the genre of the song from its audio.
However, I suggest not only to concentrate on your interests but also to listen to what people around you are talking about. What bothers them? What are they complaining about? This can be another good source of ideas for a data science project. In those cases where people are still complaining about it, this may mean that the problem wasn’t solved properly the first time around. Thus, if you challenge it with data, you could provide an even better solution and have an impact in how this topic is perceived.
This may all sound a bit too abstract, so lets find out how I came up with the idea to analyze Berlin rental prices.
“If I had known that the rental prices were so high here, I would have negotiated for a higher salary.”
This is just one of the things I heard from people who had recently moved to Berlin for work. Most newcomers complained that they hadn’t imagined Berlin to be so expensive, and that there were no statistics about possible price ranges of the apartment. If they had known this it beforehand, they could have asked for a higher salary during the job application process or could have considered other options.
I googled, checked several rental apartment websites, and asked several people, but could not find any plausible statistics or visualizations of the current market prices. And this was how I came up with the idea of this analysis.
I wanted to gather the data, build an interactive dashboard where you could select different options such as a 40m2 apartment situated in Berlin Mitte with a balcony and equipped kitchen, and it would show you the price ranges. This, alone, would help people understand apartment prices in Berlin. Also, by applying machine learning, I would be able to identify the drivers of the rental prices and practise with different machine learning algorithms.
Extracting data from the web and cleaning it
Getting the data
Now that you have an idea about your data science project, you can start looking for the data. There are tons of amazing data repositories, such as Kaggle, UCI ML Repository or dataset search engines, and websites containing academic papers with datasets. Alternatively, you could use web scraping.
But be cautious — old data is everywhere. When I was searching for the information about the rental prices in Berlin, I found many visualizations but they were old, or without any year specified.
For some statistics, they even had a note saying that this price would only be for a 2 room apartment of 50 m2 without furniture. But what if I am searching for a smaller apartment with a furnished kitchen?
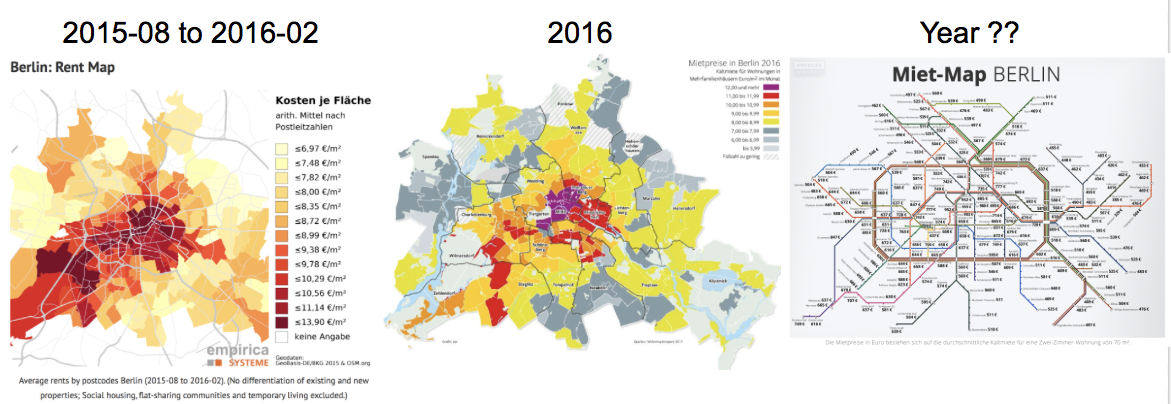
Old data is everywhere.
As I could find only old data, I decided to web scrape the websites that offered rental apartments. Web scraping is a technique used to extract data from websites through an automated process.
My web scraping blogpost goes into the details of pitfalls and design patterns of web scraping.
Here are the main findings:
- Before scraping, check if there is a public API available
- Be kind! Don’t overload the website by sending hundreds of requests per second
- Save the date when the extraction took place. It will be explained why this is important.
Data cleaning
Once you starting getting the data, it is very important to have a look at it as early as possible in order to find any possible issues.
While web scraping rental data, I included some small checks such as the number of missing values for all features. Web-masters could change the HTML of the website, which would result in my program not getting the data anymore.
Once I had ensured that all technical aspects of web scraping were covered, I thought the data would almost be ideal. However, I ended up cleaning the data for around a week because of not so obvious duplicates.
Once you starting getting the data, it is very important to have a look at it as early as possible in order to find any possible issues. For instance, if you web scrape, you could have missed some important fields. If you use a comma separator while saving data into a file, and one of the fields also contains commas, you can end up having files which are not separated very well.

ILLUSION vs REALITY
There were several sources of duplicates:
- Duplicated apartments because they had been online for a while
- Agencies had input errors, for example the rental price or the storey of the apartment. They would correct them after a while, or would publish a completely new ad with corrected values and additional description modifications
- Some prices were changed (increased and decreased) after a month for the same apartment
While the duplicates from the first case were easy to identify by their ID, the duplicates from the second case were very complicated. The reason is that an agency could slightly change a description, modify the wrong price, and publish it as a new ad so that the ID would also be new.
I had to come up with many logic-based rules to filter out the old versions of the ads. Once I was able to identify that these apartments would be the actual duplicates but with slight modifications, I could sort them by the extraction date, taking the latest one as the most recent.
Additionally, some agencies would increase or decrease the price for the same apartment after a month. I was told that if nobody wanted this apartment, the price would decrease. Conversely, I was told that, if there were so many requests for it, that the agencies increased the price. These sounds like good explanations.
Gaining deeper insights
Now that we have everything ready, we can start analyzing the data. I know data scientists love seaborn and ggplot2, as well as many static visualizations from which they can derive some insights.
However, interactive dashboards can help you and other stakeholders to find useful insights. There are many amazing easy-to-use tools for that, such as Tableau and Microstrategy.
It took me less than 30 minutes to create an interactive dashboard where one can select all the important components and see how the price would change.
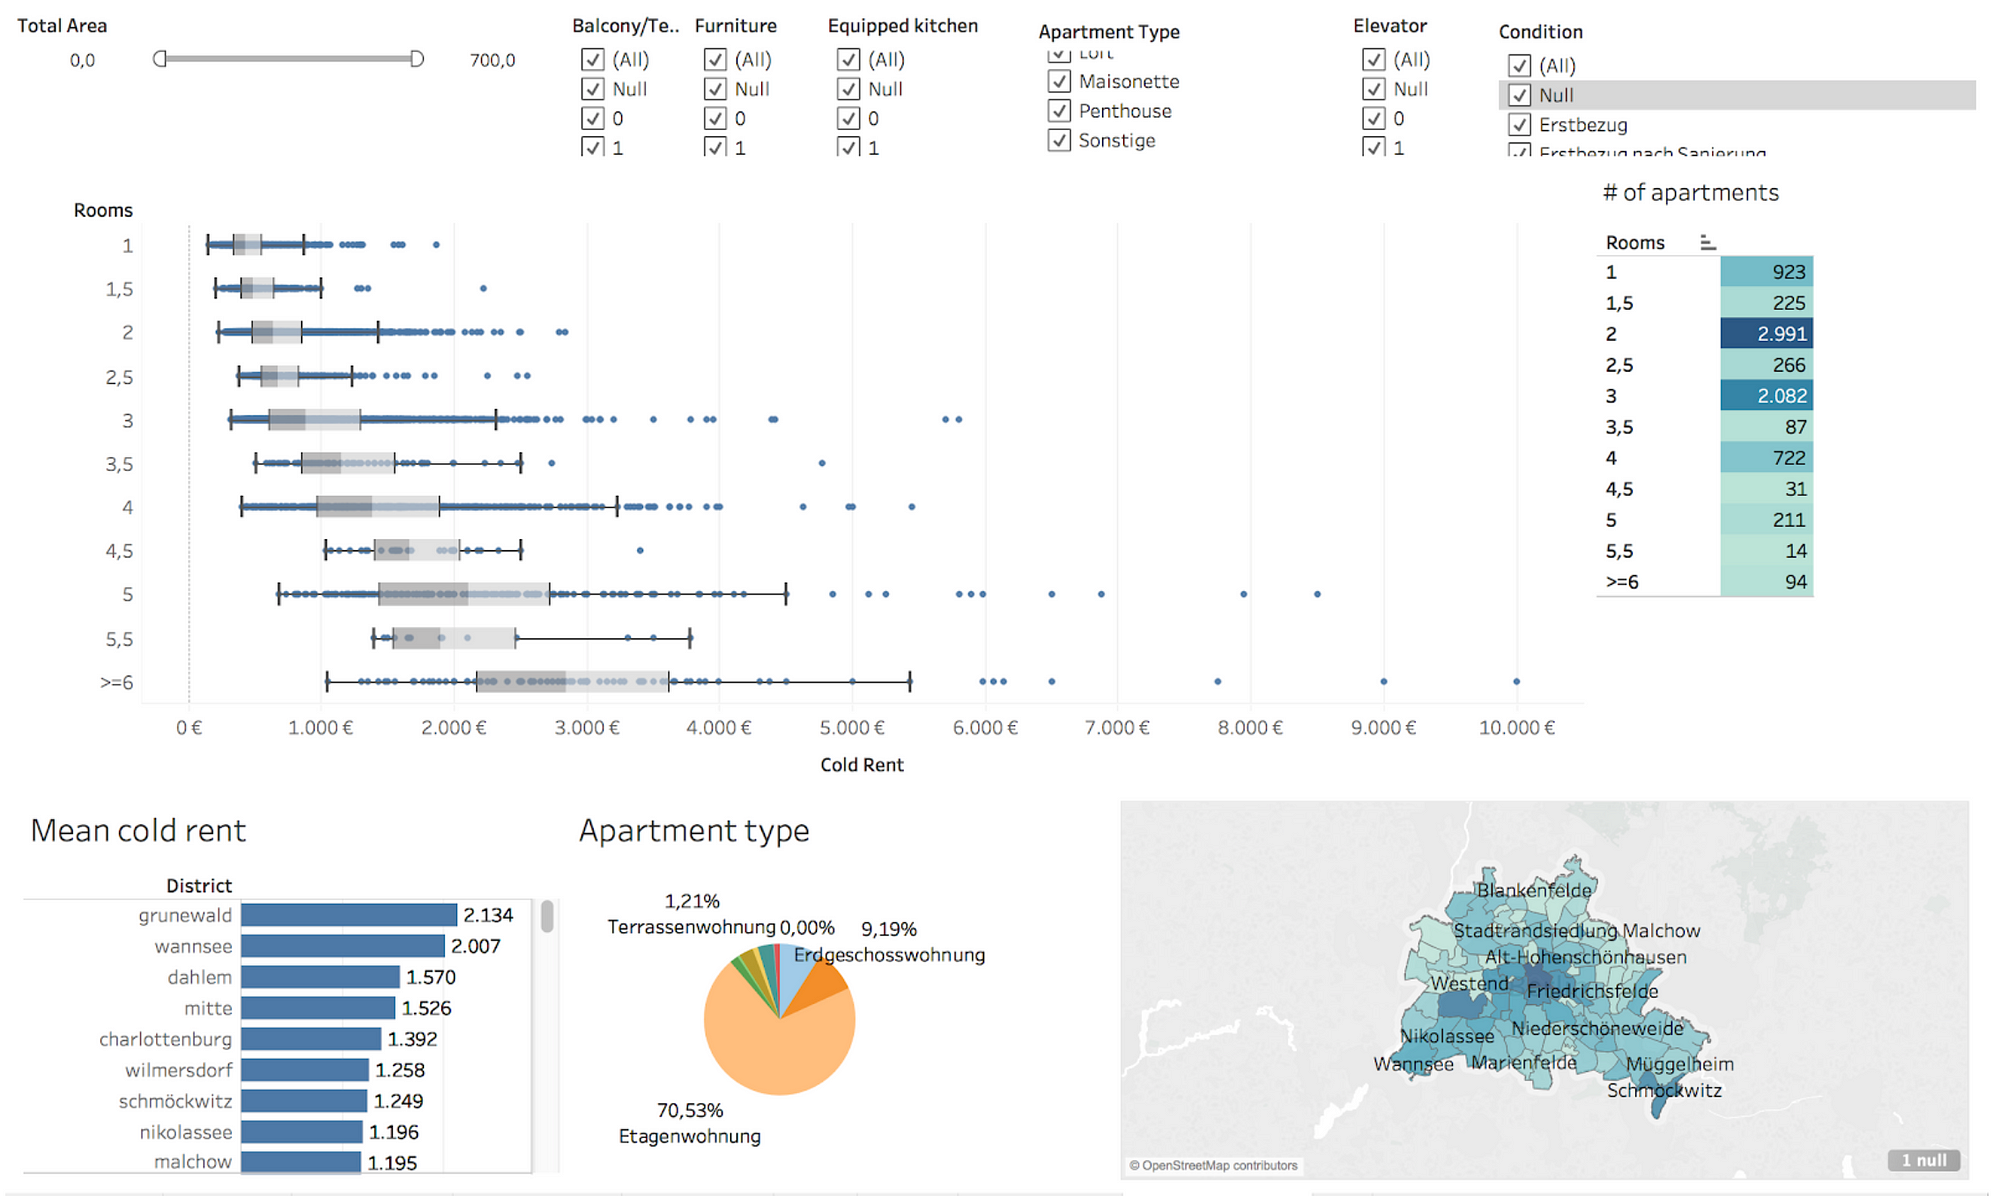
Interactive dashboard of Berlin rental prices: one can select all the possible configurations and see the corresponding price distribution. (Data date: Winder 2017/18)
A fairly simple dashboard could already provide insights into the prices in Berlin for newcomers and could be a good user driver for a rental apartment website.
Already from this data visualization you can see that the price distribution of 2.5 rooms falls into the distribution of 2 room apartment. The reason for this is that most of the 2.5 room apartments aren’t situated in the center of the city which, of course, reduces the price.
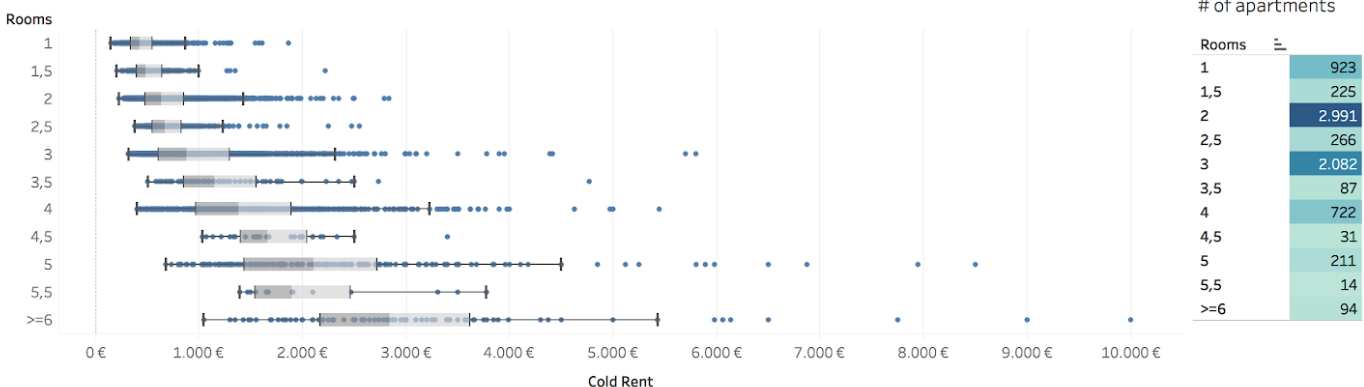
Price distribution and number of apartments in Berlin.
This data was gathered in winter 2017/18 and it will also get outdated. However, my point is that the rental websites could frequently update their statistics and visualizations to provide more transparency to this question.
Engineering of features using external APIs
Visualization helps you to identify important attributes, or “features,” that could be used by these machine learning algorithms. If the features you use are very uninformative, any algorithm will produce bad predictions. With very strong features, even a very simple algorithm can produce pretty decent results.
In the rental price project, price is a continuous variable, so it is a typical regression problem. Taking all extracted information, I collected the following features in order to be able to predict a rental price.
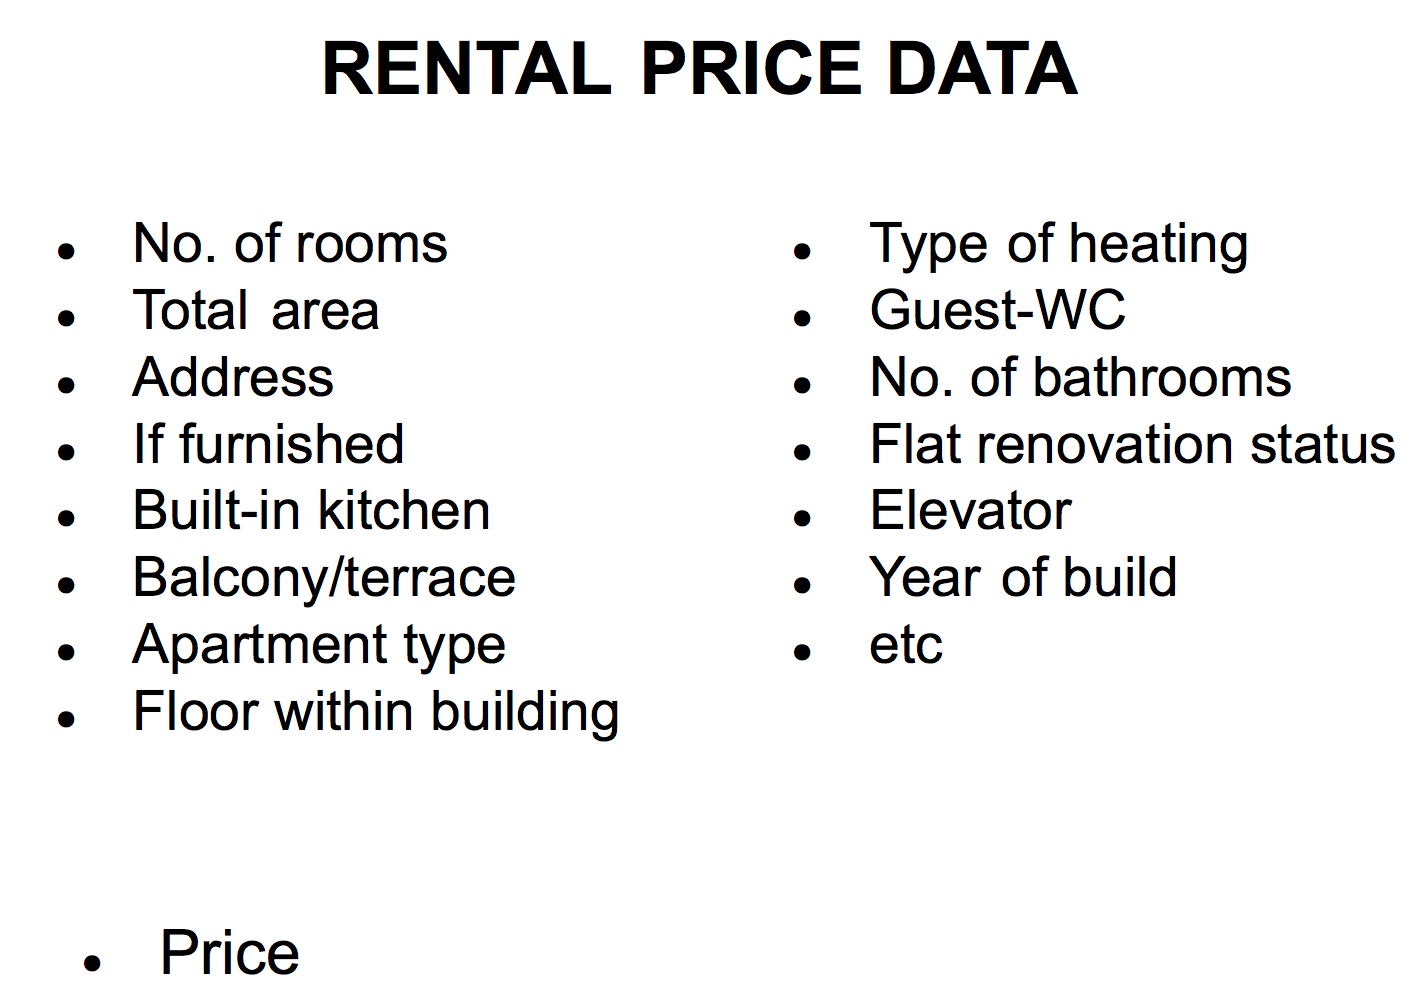
These are the majority of the features used to predict the rental apartment price.
However, there was one feature that was problematic, namely the address. There were 6.6K apartments and around 4.4K unique addresses of different granularity. There were around 200 unique postcodes which could be converted into the dummy variables but then very precious information of a particular location would be lost.
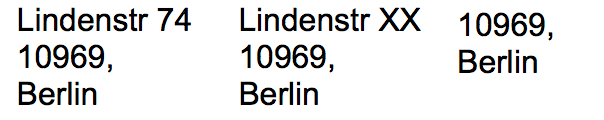
Different granularity of the address: street with the house number, street with hidden house number and only a postcode.
What do you do when you are given a new address?
You either google where it is or how to get there.
By using an external API following the four additional features given, the apartment’s address could be calculated:
- duration of a train trip to the S-Bahn Friedrichstrasse (central station)
- distance to U-Bahn Stadtmitte (city center) by car
- duration of a walking trip to the nearest metro station
- number of metro stations within one kilometer from the apartment
These four features boosted the performance significantly.
Bio: Jekaterina Kokatjuhha is a Research Engineer at Zalando, focusing on scalable machine learning for fraud prediction.
Original. Reposted with permission.
Resources:
- On-line and web-based: Analytics, Data Mining, Data Science, Machine Learning education
- Software for Analytics, Data Science, Data Mining, and Machine Learning
Related:
- Data Science Projects Employers Want To See: How To Show A Business Impact
- Text Preprocessing in Python: Steps, Tools, and Examples
- Are you buying an apartment? How to hack competition in the real estate market