 60+ useful graph visualization libraries
 60+ useful graph visualization libraries
We outline 60+ graph visualization libraries that allow users to build applications to display and interact with network representations of data.
By Elise Devaux, Linkurious
Introduction - Graphs are meant to be seen
By helping surface information, visualization tools create a bridge between graph data and viewers. Graph libraries are an important layer of the graph technology landscape. They let you build custom visualization application for network data and you can pick from a large catalog depending on your favorite language, license requirement, budget or project needs.
In the open-source world, some libraries offer many possibilities for data visualization, including graph, or network, representations. Other libraries solely focus on network diagram representations. Usually, these libraries provide more features than the generalist ones. You will also find commercial graph visualization libraries. The commercial libraries have the advantage of guaranteeing continuous technical support and advanced performances.
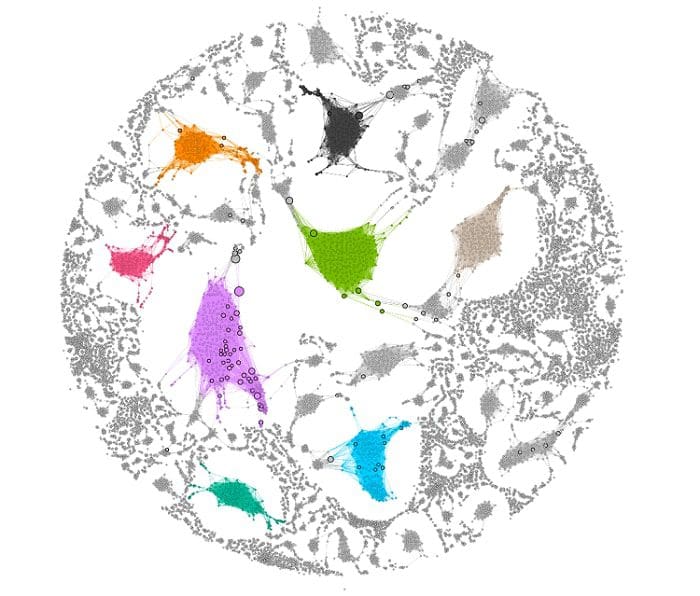
Graph visualization of the "Cosmic Web" dataset, study of the network of galaxies
List of graph visualization libraries
AfterGlow: a script written in Perl that assists with the visualization of log data. It reads CSV files and converts them into a Graph. The latest version of AfterGlow 1.6.5 was released on 07/08/13.
Alchemy.js: a JavaScript graph drawing application built in d3 to get up and running with graph visualization applications. Most customization of the application takes place by overriding default configurations, rather than direct implementation via JavaScript.
Arbor.JS: a JavaScript graph visualization library released under MIT license using web workers and jQuery. Arbor provides a force-directed layout algorithm plus abstractions for graph organization and screen refresh handling, leaving the actual screen-drawing to you. You can use it with canvas, SVG, or even positioned HTML elements.
ccNetViz: a lightweight JavaScript library for large network graphs visualization using WebGL. It is an open source library available under GPLv3 License developed in the Helikar Lab.
Circos: a software package in Perl for visualizing data and information. It visualizes data in a circular layout.
Cola.JS: an open-source JavaScript library released under the MIT License for arranging your HTML5 documents and diagrams using constraint-based optimization techniques.
It works well with libraries like D3.js, svg.js, and Cytoscape.js. The core layout is based on a complete rewrite in JavaScript of the C++ LibCola library.
Cytoscape.js: a graph library written in pure JS with a permissive open source license (MIT) for the core Cytoscape.js library and all first-party extensions. It is used in commercial projects and open-source projects in production and designed for users first, for both front-facing app use-cases and developer use-cases. It includes graph theory algorithms, from BFS to PageRank.
D3.JS: a JavaScript library for manipulating documents based on data using HTML, SVG, and CSS. D3 combines visualization components and a data-driven approach to DOM manipulation.
Dagre-d3: a JavaScript library released under the MIT License to lay out directed graphs on the client-side. The dagre-d3 library acts as a front-end to Dagre, providing actual rendering using D3.
Dash Cytoscape: a Component Library for Dash aimed at facilitating network visualization in Python, wrapped around Cytoscape.js.
Dracula Graph library: a JavaScript library released under the MIT License to display and layout interactive connected graphs and networks, along with various related algorithms from the field of graph theory. Just plain JavaScript and SVG.
El Grapho: a JavaScript WebGL graph data visualization framework to visualize and interact with large-graphs. It is release under the MIT License.
Flare: an ActionScript library for creating visualizations that run in the Adobe Flash Player. The toolkit supports data management, visual encoding, animation, and interaction techniques.
G6: a JavaScript graph visualization framework released under the MIT License which provides a set of basic mechanisms, letting developers build graph visualization analysis application or graph visualization modeling application.
GDToolkit (GDT): a C++ Graph Drawing Toolkit designed to manipulate several types of graph, and to automatically draw them according to many different aesthetic criteria and constraints.
GGraph: a graph visualization library for big data released under the Apache 2.0 License. It’s built on top D3 and extends the notion of nodes and links with groups of nodes.
GoJS: a proprietary JavaScript and TypeScript library for building interactive diagrams and graphs.
Grano: an open source Python tool for journalists and researchers who want to track networks of political or economic interest. It helps understand the most relevant relationships in your investigations, and to merge data from different sources.
GraphGL: a JavaScript network visualization library released under the MIT License. It is designed for rendering large graphs in web browsers and dynamic graph exploration. It is suitable for static files (exported GraphML/GEXF files converted to JSON) and for dynamic files.
Graphosaurus: a three-dimensional JavaScript static graph viewer powered by WebGL (three.js) released under the MPL License.
Graph Stream: a Java library for the modeling and analysis of dynamic graphs. You can generate, import, export, measure, layout and visualize them.
Graph Tool: a Python module for manipulation and statistical analysis of graphs. The core data structures and algorithms are implemented in C++.
Graphviz: a variety of C software for drawing attributed graphs and implementing a handful of common graph layout algorithms. The Graphviz layout programs take descriptions of graphs in a simple text language and make diagrams in formats such as images and SVG for web pages; PDF or Postscript for inclusion in other documents; or display in an interactive graph browser.
Graphvy: basic graph (data) exploration and visualization using Kivy and released under the MIT License.
H3Viewer: a JavaScript library providing layout and navigation of node-link graphs in 3D hyperbolic space. The library can handle graphs of over to 300,000 edges.
igraph: a collection of network analysis tools open source and free. igraph can be programmed in R, Python, Mathematica and C/C++.
ipysigma: a custom Jupyter widget library to display graphs using sigma.js, released under the Apache 2.0 License.
JavaScript Diagram: a commercial JavaScript library for visualizing, creating, and editing interactive diagrams. It supports creating flowcharts, organizational charts, mind maps, and BPMN charts either through code or a visual interface.
Java Universal Network/Graph Framework (JUNG): a Java software library that provides a common language for the modeling, analysis, and visualization of data that can be represented as a graph or network.
JavaScript InfoVis Toolkit: a Toolkit for creating Interactive Data Visualizations for the Web, released under the MIT License
Joint JS: a JavaScript diagramming library released under the MLP License 2.0 with features to support visualization and interaction with diagrams and graphs.
JS Graph it: a JavaScript library for graphs representation that allows you to connect your HTML elements using CSS classes to declare blocks, connectors, labels without Javascript code. JS Graph is released under the Apache 2.0 License
jsPlumb: a JavaScript graph library released under the MIT License to visually connect elements on their web pages. It uses SVG and runs on all browsers from IE9 and later.
Keylines : a commercial JavaScript software development kit (SDK) for building applications to visualize and analyze complex connected data.
LargeViz: a C++ tool released under the Apache 2.0 License to visualize large-scale and high-dimensional data. It supports visualizing both high-dimensional feature vectors and networks.
multiNetX: a python package, released under the GNU Public License, for the manipulation and visualization of multilayer networks. The core of this package is a MultilayerGraph, a class that inherits all properties from networkx.Graph().
Muxviz: a framework for the analysis and visualization of interconnected multilayer networks. It is released under the GNU General Public License v3.0.
mxGraph: a client side JavaScript diagramming library, released under the Apache 2.0 License, that uses SVG and HTML for rendering. draw.io is an example that extends the functionality of this library.
Neovis Js: a JavaScript graph library combining Neo4j and vis.js to produce graph visualizations in the browser with data from Neo4j. You can connect to Neo4j instance to get live data, specify labels and property to be displayed, specify Cypher query to populate.
NetJSON: a JavaScript tool, released under BSD License, to leverage d3.js to visualize network topology using the NetJSON NetworkGraph format.
NetworkCube: an open source JavaScript / Typescript visualization library for multivariate dynamic networks.
NodeBox: a Graph library in Python released under the GPL to visualize small graphs (<200 elements) with algorithms from NetworkX for betweenness centrality and eigenvector centrality.
OGDF: a self-contained C++ class library for the automatic layout of diagrams. OGDF offers algorithms and data structures to use within your own applications or scientific projects. The library is available under the GNU General Public License.
Ogma: a commercial JavaScript library for large-scale graph visualization and interaction, developed by Linkurious.
Popoto.js: a JavaScript library built with D3.js designed to create visual query builder for Neo4j graph databases. The graph queries are translated into Cypher and run on the database. It is released under the GNU Public License.
Processing.JS: the JavaScript port of the Processing visual programming language. It allows web browsers to display animations, visual applications, games and other graphical rich content without any plug-ins.
Protovis: a JavaScript library released under the BSD License, to compose custom views of data with simple marks such as bars and dots. Protovis is no longer under active development.
Py3Plex: a Python library released under the BSD License, providing algorithms for decomposition, visualization and analysis of graph data.
PyGraphistry: a Python visual graph analytics library to extract, transform, and load big graphs into Graphistry's cloud-based graph explorer.
Quickgraph: a C# open source tool providing generic directed/undirected graph data structures and algorithms for .NET. QuickGraph supports MSAGL, GLEE, and Graphviz to render the graphs, serialization to GraphML.
Rapidd: a commercial diagramming framework to build complex applications, combining HTML 5 + SVG technologies. Rappid is the commercial extension to the JointJS Core library.
Sigma.JS: a JavaScript library released under the MIT license and dedicated to graph drawing. It lets developers publish networks on Web pages and integrate network exploration in rich Web applications.
Soba: a JavaScript visualization toolkit released under the MIT license. Soba is a 2D plotting library integrated with Sushi written in JavaScript.
SoNIA: a Java-based package for visualizing dynamic or longitudinal "network" data. It is released un der the GNU GPL License.
Statnet: an integrated set of R tools for the representation, visualization, analysis, and simulation of network data. It is released under GPL-3.
Tom Sawyer Perspectives: a commercial graph SDK with a graphics-based design and preview environment. The platform integrates enterprise data sources with a graph visualization, layout, and analysis technology.
Tulip: a information visualization framework dedicated to the analysis and visualization of relational data. Written in C++ the framework enables the development of algorithms, visual encodings, interaction techniques, data models, and domain-specific visualizations.
uGraph: an MIT-license open source JavaScript & SVG library for implementing custom interactive diagrams.
Vis.JS: is a JavaScript browser-based visualization library released under the Apache 2.0 License. The library enable manipulation of and interaction with large amounts of dynamic data.
visNetwork: VisNetwork is a Proprietary R package, using vis.js library for network visualization.
VivaGraphJS: a graph drawing library for JavaScript designed to support different rendering engines and layout algorithms.
yFiles: a commercial programming library for visualizing any kind of diagram, graph, or network.
Bio: Elise Devaux is a tech-enthusiast and marketing project manager. She currently works with Linkurious' team and partners to cover the emerging graph technology use cases.
Resources:
- On-line and web-based: Analytics, Data Mining, Data Science, Machine Learning education
- Software for Analytics, Data Science, Data Mining, and Machine Learning
Related: