 Object-oriented programming for data scientists: Build your ML estimator
 Object-oriented programming for data scientists: Build your ML estimator
Implement some of the core OOP principles in a machine learning context by building your own Scikit-learn-like estimator, and making it better.
UPDATE: You will always find the latest Python script (with the linear regression class definition and methods) HERE. Use it to build further or experiment.
What is the problem?
Data scientists often come from a background which is quite far removed from traditional computer science/software engineering — physics, biology, statistics, economics, electrical engineering, etc.
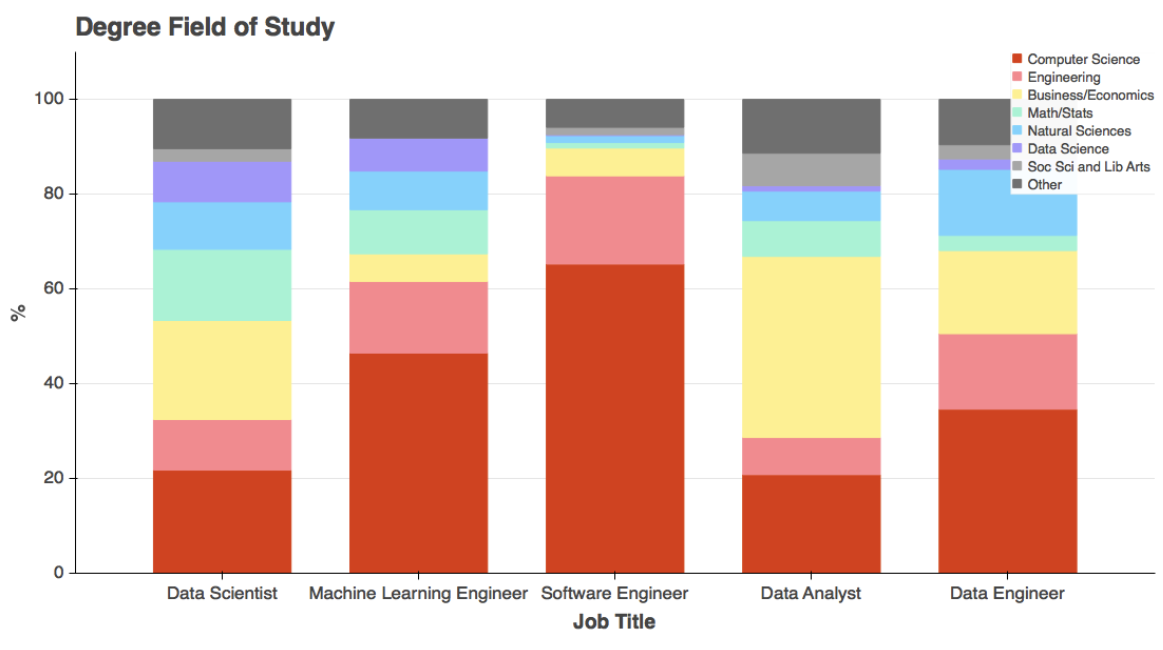
But ultimately, they are expected to pick up a sufficient amount of programming/software engineering to be truly impactful for their organization and business.
Being a Data Scientist does not make you a Software Engineer!
How to build scalable Machine Learning systems — Part 1/2
And, what is at the heart of most modern programming languages and software engineering paradigms?
Object-oriented programming (OOP).
But the principles of OOP can feel little alien or even intimidating to the uninitiated at first. Consequently, data scientists, whose background did not include formal training in computer programming, may find the concepts of OOP somewhat difficult to embrace in their day-to-day work.
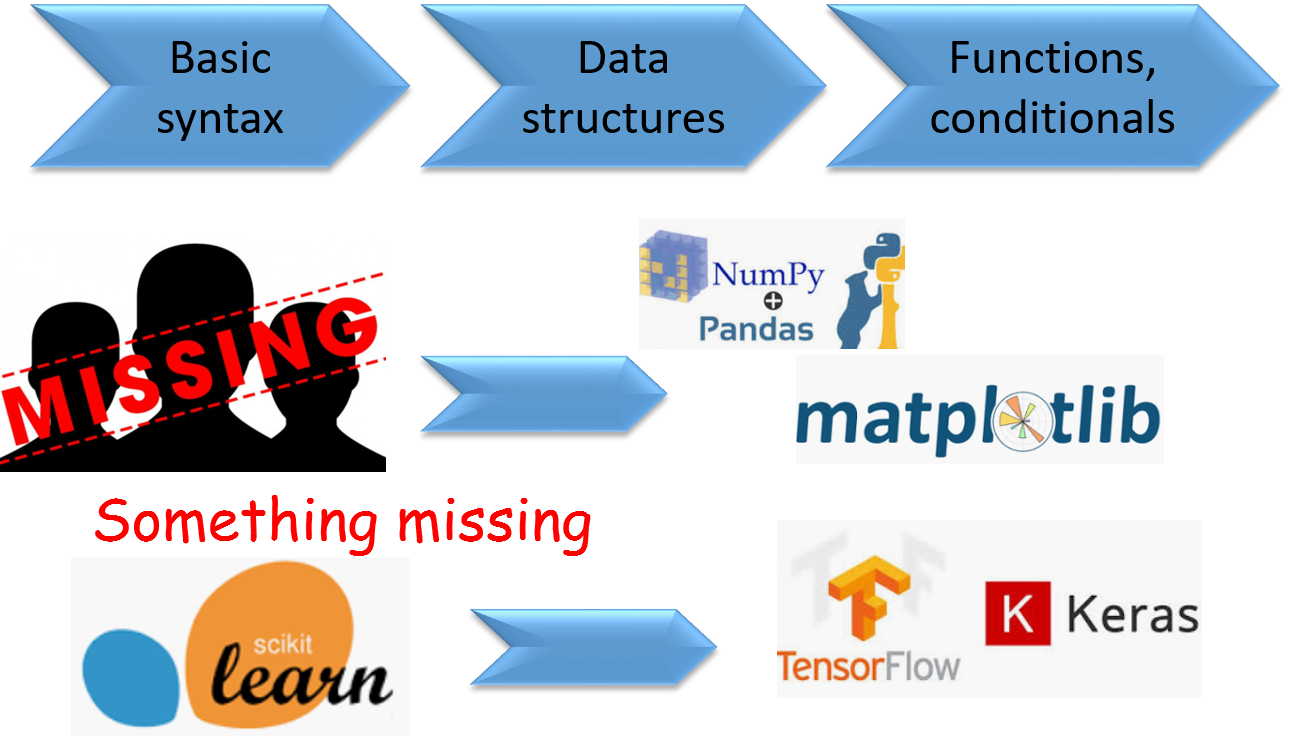
The popular MOOCs and boot camps for data science/AI/ML do not help either.
They try to give the budding data scientists the flavor of a mixed soup of statistics, numerical analysis, scientific programming, machine learning (ML) algorithms, visualization, and perhaps even a bit of web framework to deploy those ML models.
Almost all of these can be learned and practiced even without rigorously adhering to the principles of OOP. In fact, young data scientists, who are hungry to learn the latest neural network architecture or the coolest data visualization techniques, may even feel suffocated if bombarded with all the nitty-gritty of the OOP programming paradigm. So, the MOOCs don’t generally mix or emphasize it in their data science curriculum.
A simple example (and some more…)
Let me give an example of this problem using Python, as it is the fastest growing language for data science and machine learning tasks.
The arithmetic example
If you are asked to write a program to implement addition, subtraction, multiplication, and division involving a couple of numbers a and b, what will you most likely do?
You will most likely open up a Jupyter notebook and type the following in a cell, hit shift-enter and get the result.
a+b
a-b
a*b
a/b
If you like to tidy things up by working with functions, then you may do,
def add(a,b):
    return a+b
...
But will you go as far as defining (complete with an initializer method) a Calc class and putting these functions inside that class as methods? These are all operations of a similar nature and they work on similar data. Why not encapsulate them within a single higher-order object then? Why not the following code?
class Calc:
    def __init__(self,a,b):
        self.a = a
        self.b = b
    def add(self):
        return self.a+self.b
    def sub(self):
        return self.a-self.b
    def mult(self):
        return self.a*self.b
    def div(self):
        return self.a/self.b
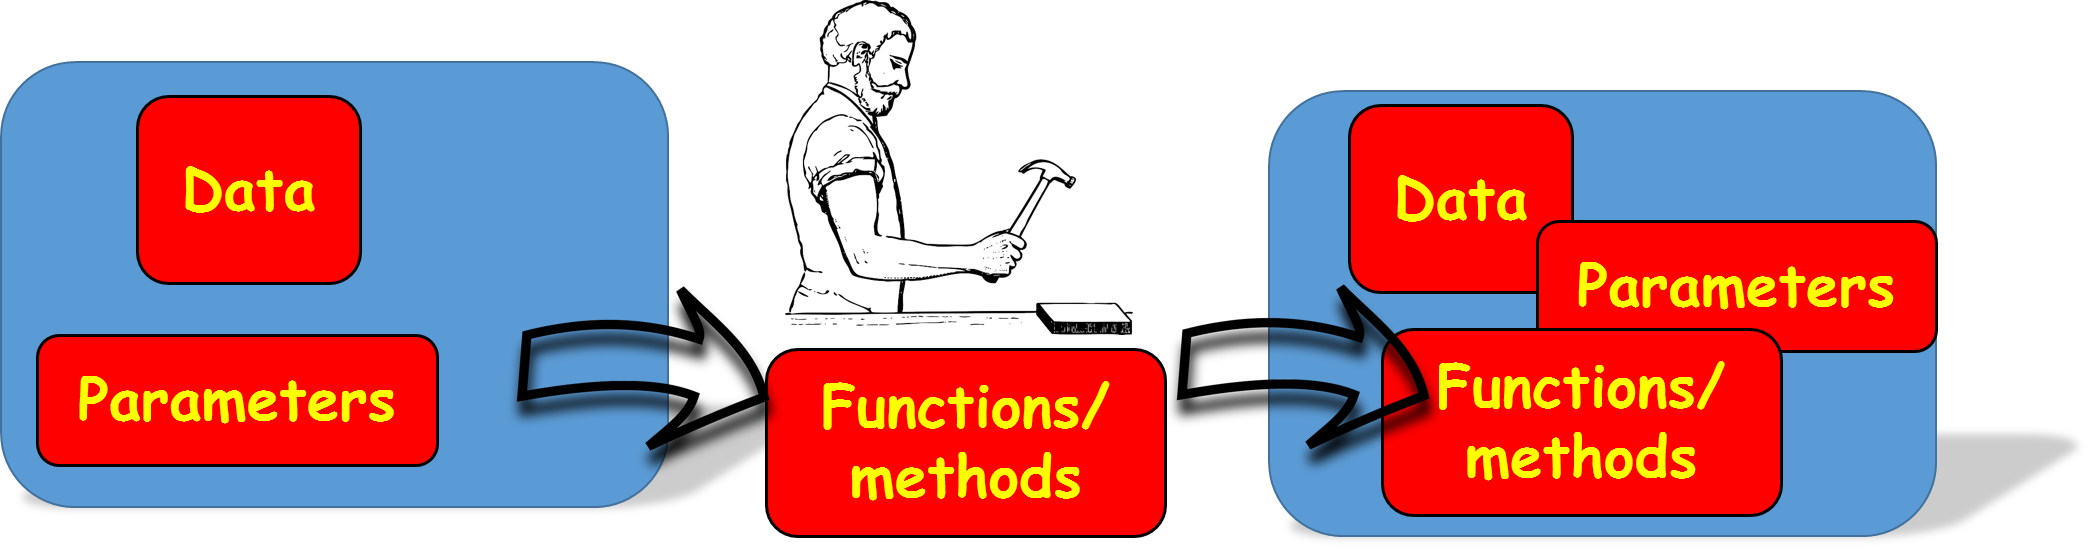
No, you won’t do this. It probably does not make sense to do it for this particular problem either. But the idea is valid — if you have data and functions (methods as they are called in the parlance of OOP), which can be combined logically, then they should be encapsulated in a class.
But it looks too much work just for getting quick answers to some simple numerical computations. So, what’s the point? Data scientists are often valued on whether they can get the right answer to the data problem, not on what elaborate objects they are using in the code.
Data scientist’s example
If data scientists are not coding this way, is it not the case, that they really don’t need to use these elaborate programming constructs?
Wrong.
Without consciously being aware, data scientists make heavy use of the benefits of the OOP paradigm. All the time.
Remember plt.plot after import matplotlib.pyplot as plt?
Those . symbols. You have a dash of object-oriented programming. Right there.
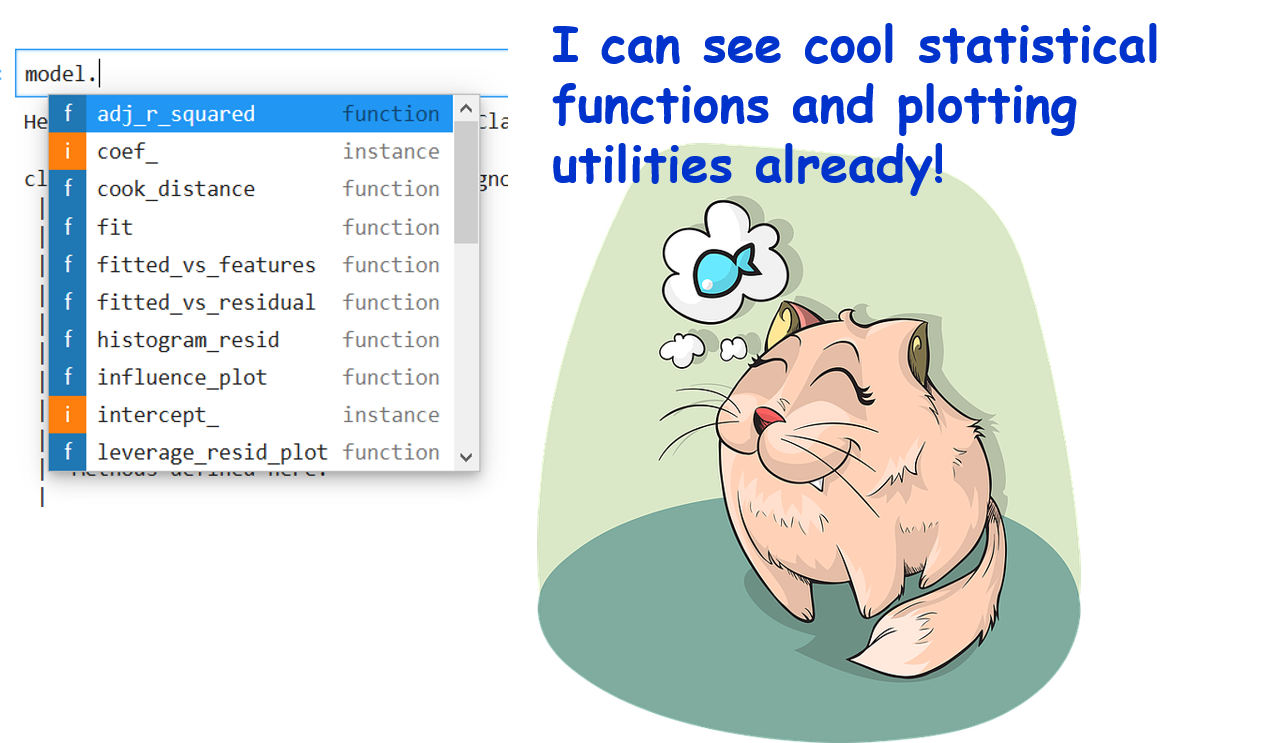
Or, do you remember being happy to learn the cool trick in the Jupyter notebook — hitting Tab after putting a DOT (.), thereby showing all the functions that can be associated with an object? Like this,
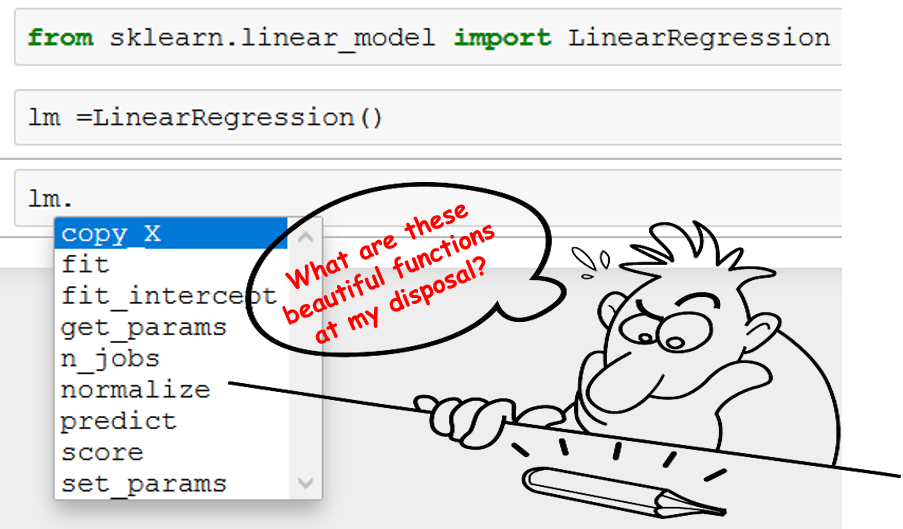
What does this example show?
This example shows adherence to logical consistency.
Without the OOP paradigm, we would have to name those functions as linear_model_linear_regression_fit,linear_model_linear_regression_predict, and so on. They won’t be grouped under a common logical unit.
Why? Because they are different functions and work on a different set of data. While the fit function expects both training features and targets, predictneeds only a test data set. The fit function is not expected to return anything, while predict is expected to return a set of predictions.
So, why are they visible under the same drop-down? In spite of being different, they have the commonality that they can both be imagined to be essential parts of the overall linear regression process — we expect a linear regression to fit some training data, and then be able to predict for future unseen data. We also expect the linear regression model to provide us some indication about how good the fit was — generally in the form of a single numeric quantity or score called coefficient of regression or R². As expected, we see a function score, which returns exactly that R² number, also hanging around fitand predict.
Neat and clean, isn’t it?
Data, functions, and parameters are cohabitating inside a single logical unit.
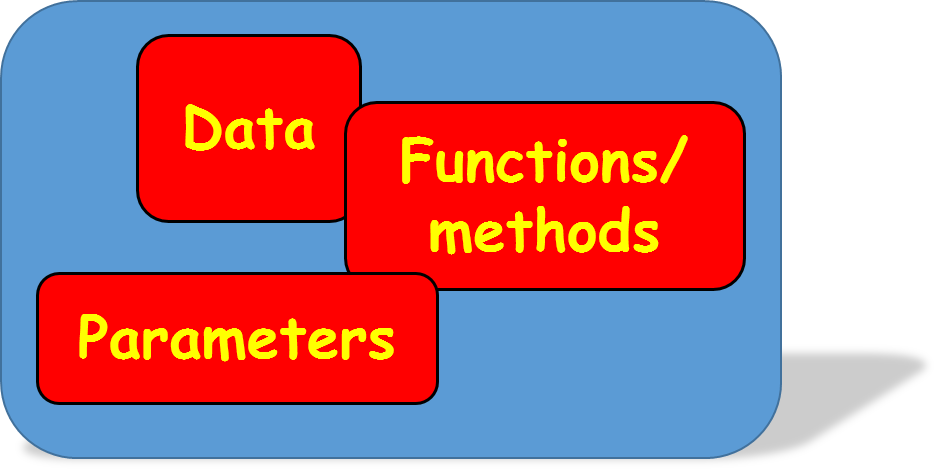
How was it made possible?
It was possible because we rose above the individual differences and thought about the linear regression as a high-level process and decided what essential actions it should serve and what critical parameters it should inform its users about.
We made a high-level class called LinearRegression under which all those apparently disparate functions can be grouped together for easy book-keeping and enhanced usability.
Once we imported this class from the library, we just had to create an instance of the class — we called it lm. That’s it. All the functions, grouped under the class, became accessible to us through that newly defined instance lm.
If we are not satisfied with some of the internal implementation of the functions, we can work on them and re-attach them to the main class after modification. Only the code of the internal function changes, nothing else.
See, how logical and scalable it sounds?
Create your own ML estimator
Traditional introduction to OOP will have plenty of examples using classes such as — animals, sports, geometric shapes.
But for data scientists, why not illustrate the concepts using the example of an object they use every day in their code — a machine learning estimator. Just like the lm object from the Scikit-learn library, shown in the picture above.
A good, old Linear Regression estimator — with a twist
In this Github repo, I have shown, step-by-step, how to build a simple linear regression (single or multivariate) estimator class following the OOP paradigm.
Yes, it is the good old linear regression class. It has the usual fit and predictmethods as in the LinearRegression class from Scikit-learn. But it has more functionalities. Here is a sneak peek…
Yes, this estimator is richer than the Scikit-learn estimator in the sense that it has, in addition to standard fit, predict, and R² score functions, a host of other utilities which are essential for a linear regression modeling task.
Especially, for data scientists and statistical modeling folks — who not only want to predict but also would like to
- measure the Goodness of fit,
- verify the assumptions of the linear regression,
- check for multicollinearity in the data, or
- detect outliers.
How do you check the quality of your regression model in Python?
Linear regression is rooted strongly in statistical learning and therefore the model must be checked for the ‘goodness…
How do you start building the class?
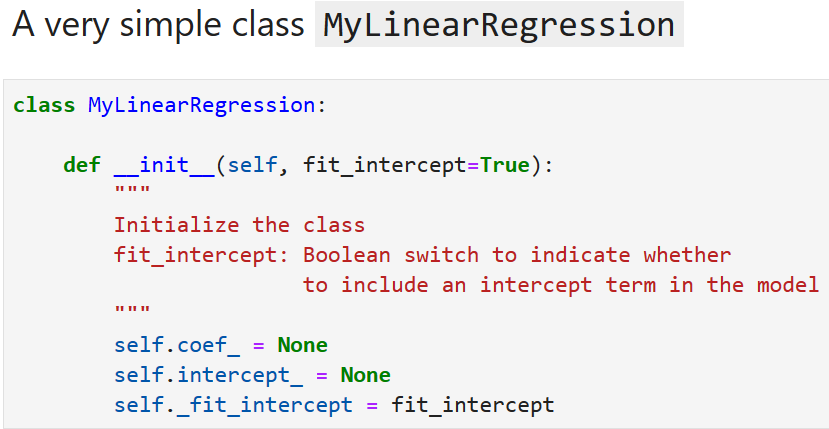
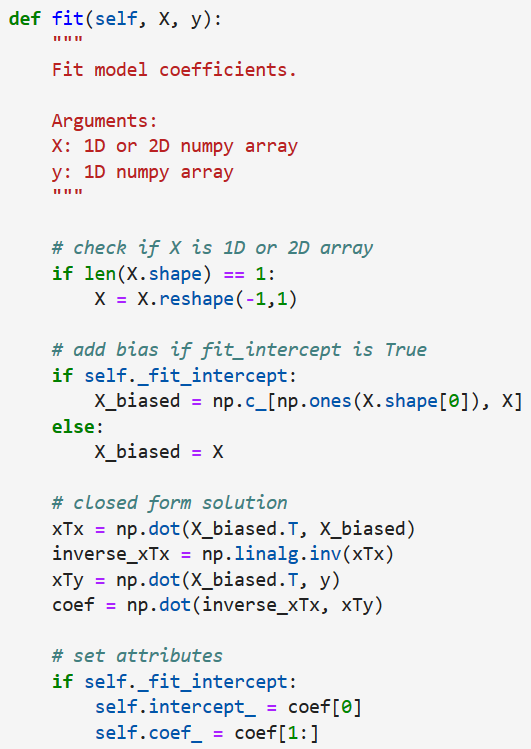
We start with a simple code snippet to define the class. We name it — MyLinearRegression.
Here, self denotes the object itself and __init__ is a special function which is invoked when an instance of the class is created somewhere in the code. As the name suggests, __init__ can be used to initialize the class with necessary parameters (if any).
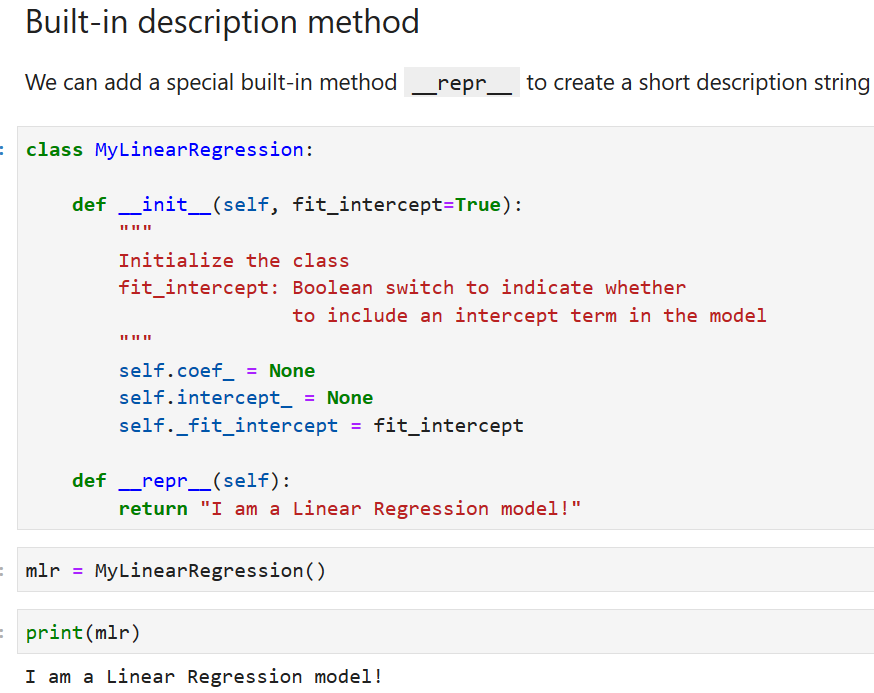
We can add a simple description string to keep it honest :-)
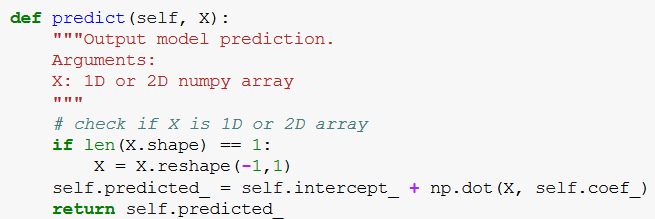
We add the core fit method next. Note the docstring describing the purpose of the method, what it does and what type of data it expects. All of these are part of good OOP principles.
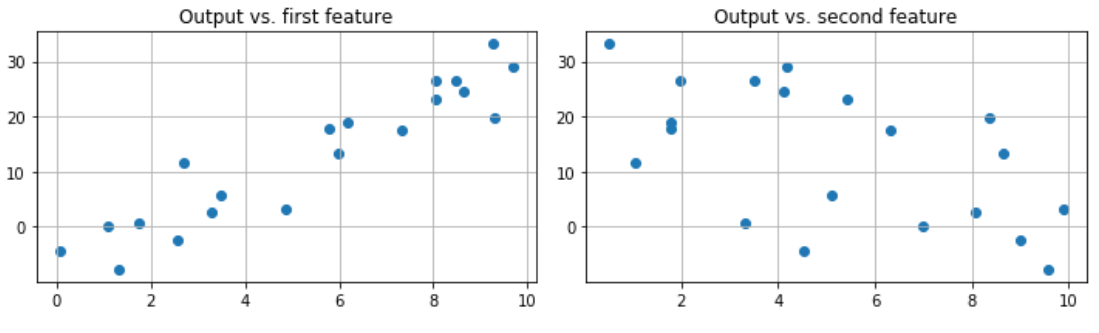
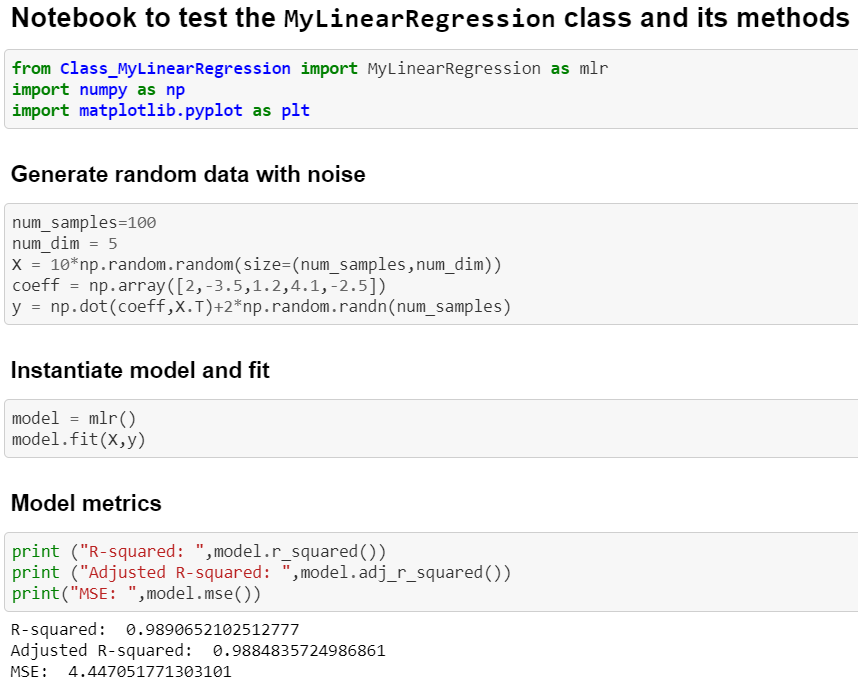
We can generate some random data to test our code so far. We create a linear function of two variables. Here are the scatter plots of the data.
Now, we can create an instance of the class MyLinearRegression called mlr. What happens if we try to print the regression parameters?
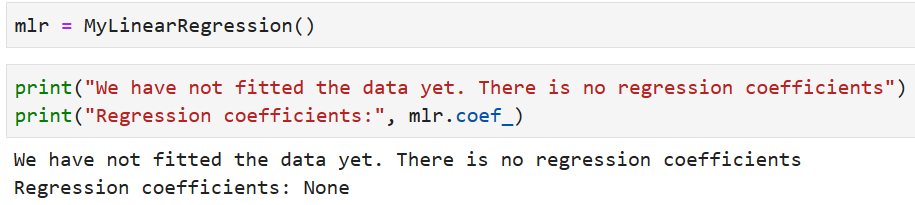
Because the self.coef_ was set to None, we get the same while trying to print mlr.coef_. Note, how the self became synonymous to the instance of the class — mlr once it is created.
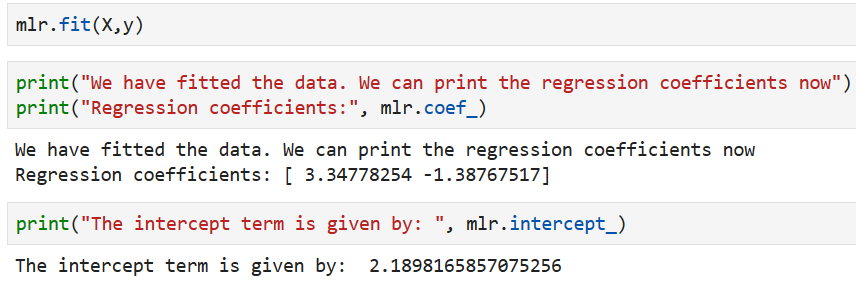
But the definition of fit includes setting the attributes once the fitting is done. Therefore, we can just call mlr.fit() and print out the fitted regression parameters.
The quintessential Predict method
After fitting, comes prediction. We can add that method easily to our regression class.
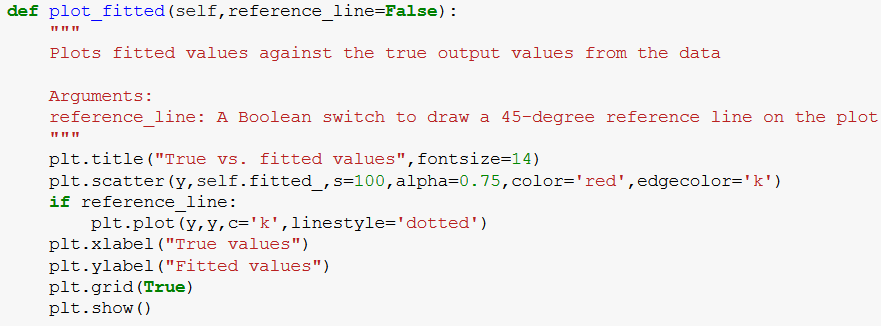
What if we want to add a (or a few) plotting utility function?
At this point, we start expanding our regression class and add stuff which is not even present in the standard scikit-learn class! For example, we always want to see how the fitted values compare to the ground truth. It is easy to create a function for that. We will call it plot_fitted.
Note that a method is like a normal function. It can take additional arguments. Here, we have an argumentreference_line (default set to False) which draws a 45-degree reference line on the fitted vs true plot. Also, note the docstring description.
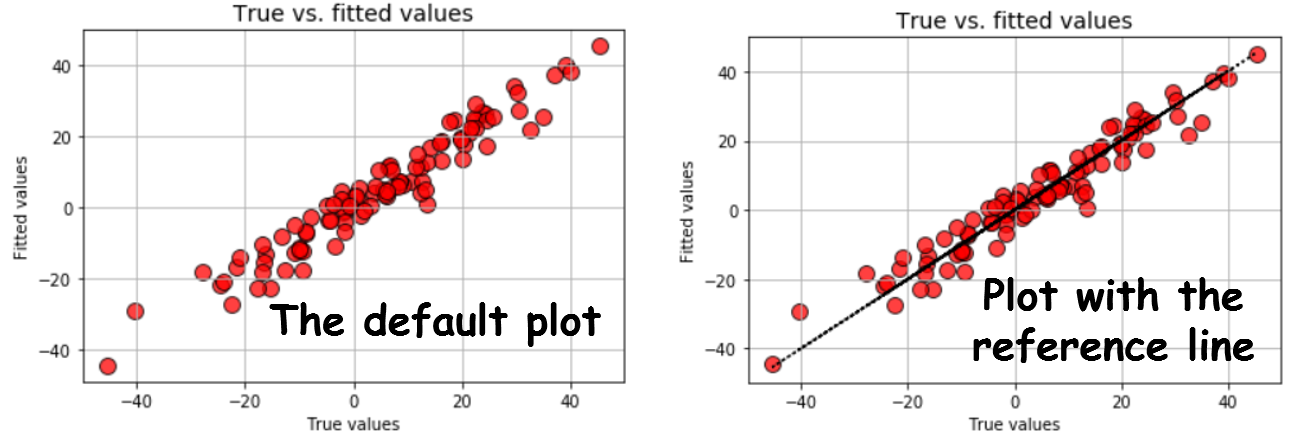
We can test the methodplot_fitted by simply doing the following,
m = MyLinearRegression()
m.fit(X,y)
m.plot_fitted()
Or, we can opt to draw the reference line,
m.plot_fitted(reference_line=True)
We get the following plots!
Once we understood that we can add any useful methods to work on the same data (a training set), related to the same purpose (linear regression), there is no bound to our imagination! How about we add the following plots to our class?
- Pairplots (plots pairwise relation between all features and outputs, much like the
pairsfunction in R) - Fitted vs. residual plot (this falls under diagnostic plots for the linear regression i.e. to check the validity of the fundamental assumptions)
- Histogram and the quantile-quantile (Q-Q) plot of the residuals (this checks for the assumption of Normality of the error distribution)
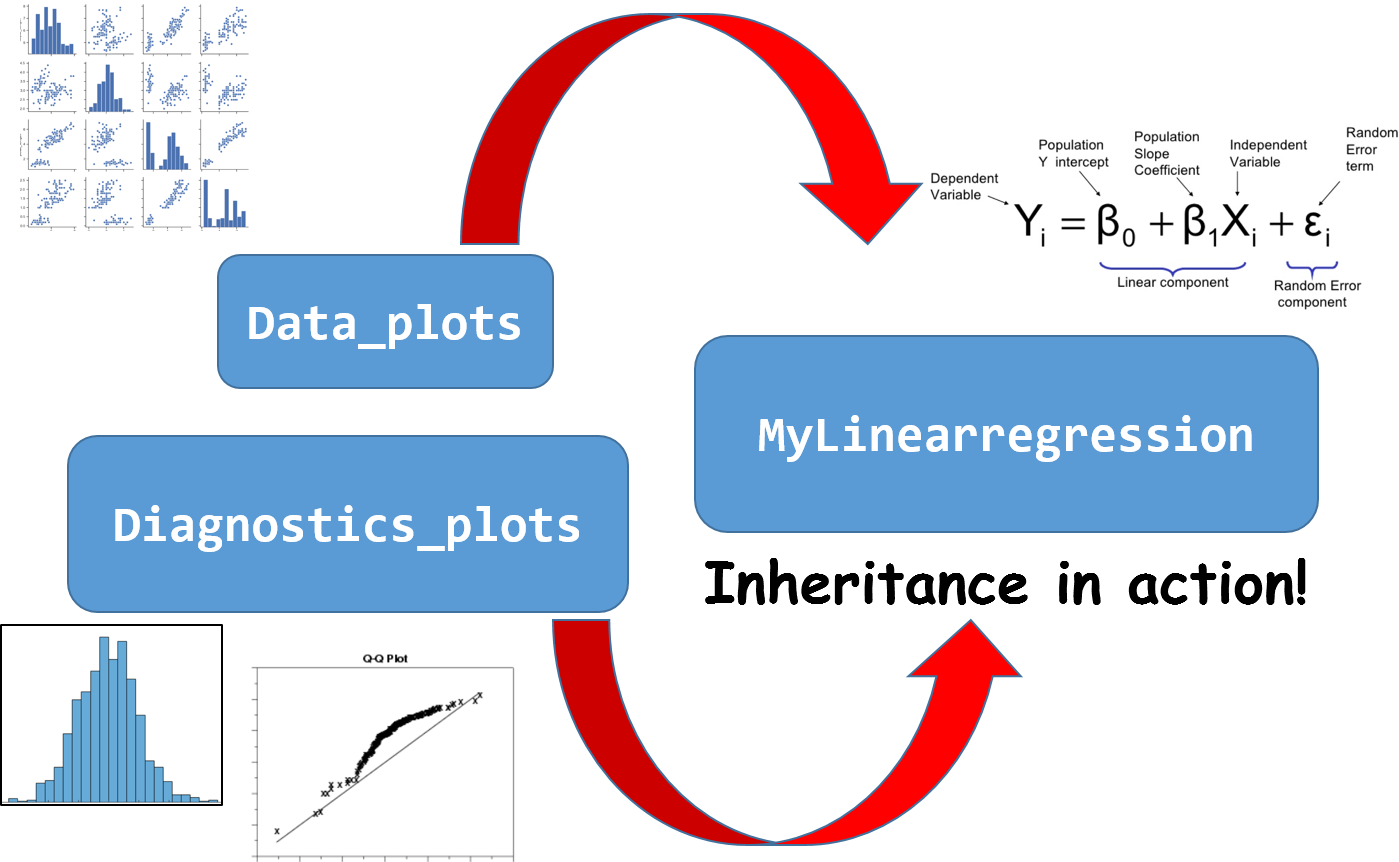
Inheritance — don’t overburden your main class
As we enthusiastically plan utility methods to add to the class, we recognize that this approach may make the code of the main class very long and difficult to debug. To solve the conundrum, we can make use of another beautiful principle of OOP — inheritance.
Inheritance in Python - GeeksforGeeks
Inheritance is the capability of one class to derive or inherit the properties from some another class. The benefits of…
We further recognize that all plots are not of the same type. Pairplots and fitted vs. true data plots are of similar nature as they can be derived from the data only. Other plots are related to the goodness-of-fit and residuals.
Therefore, we can create two separate classes with those plotting functions — Data_plots and Diagnostic_plots.
And guess what! We can define our main MyLinearRegression class in terms of these utility classes. That is an instance of inheritance.
Note: This may seem a little different from standard parent class-child class inheritance practice but for the same feature of the language is used here for keeping the main class clean and compact while inheriting useful methods from other similarly constructed classes.
Note the following code snippets are only for illustration. Please use the Github link above to see the actual code.
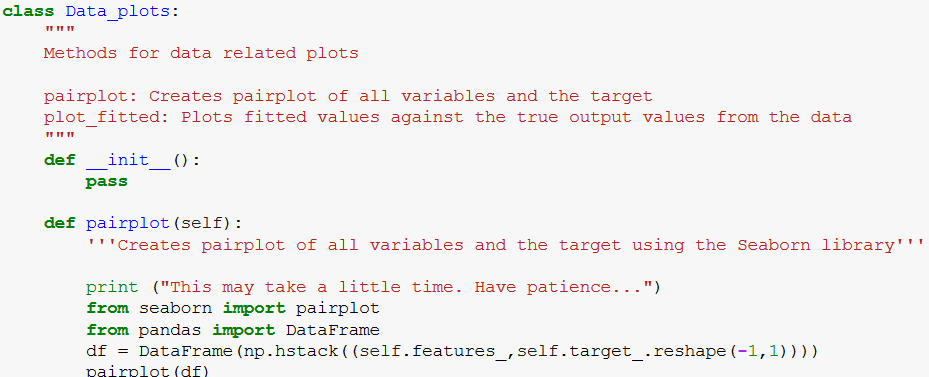
Data_plots class
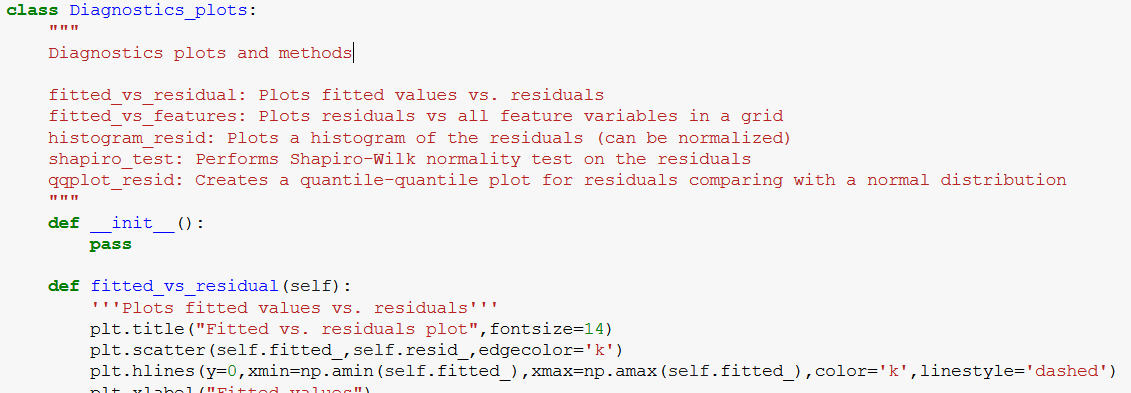
Diagnostics_plots class
And the definition of MyLinearregression is changed only slightly,
class MyLinearRegression(Diagnostics_plots,Data_plots):

    def __init__(self, fit_intercept=True):
        self.coef_ = None
        self.intercept_ = None
        self._fit_intercept = fit_intercept
...
By simply passing on the reference of Data_plots and Diagnostics_plots to the definition of MyLinearRgression class, we inherit all the methods and properties of those classes.
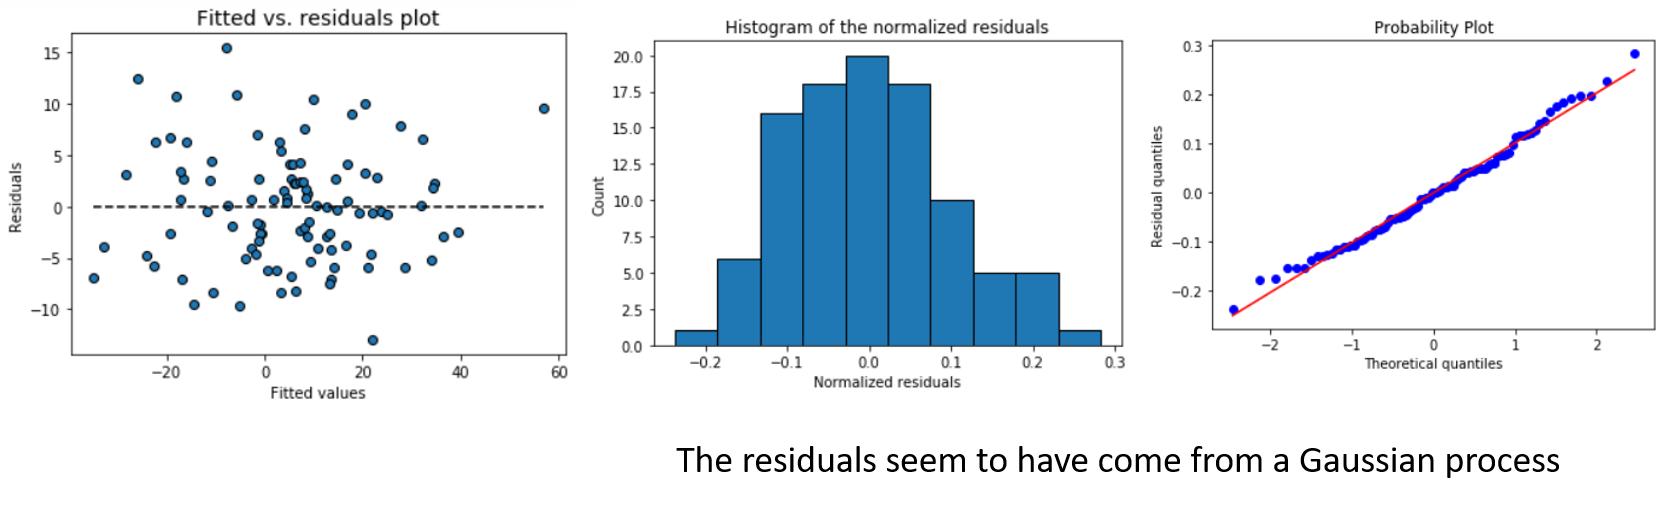
Now, to check the Normality assumptions of the error terms, we can simply fit the model and run those methods.
m = MyLinearRegression() # A brand new model instance
m.fit(X,y) # Fit the model with some datam.histogram_resid() # Plot histogram of the residuals
m.qqplot_resid() # Q-Q plot of the residuals
We get,
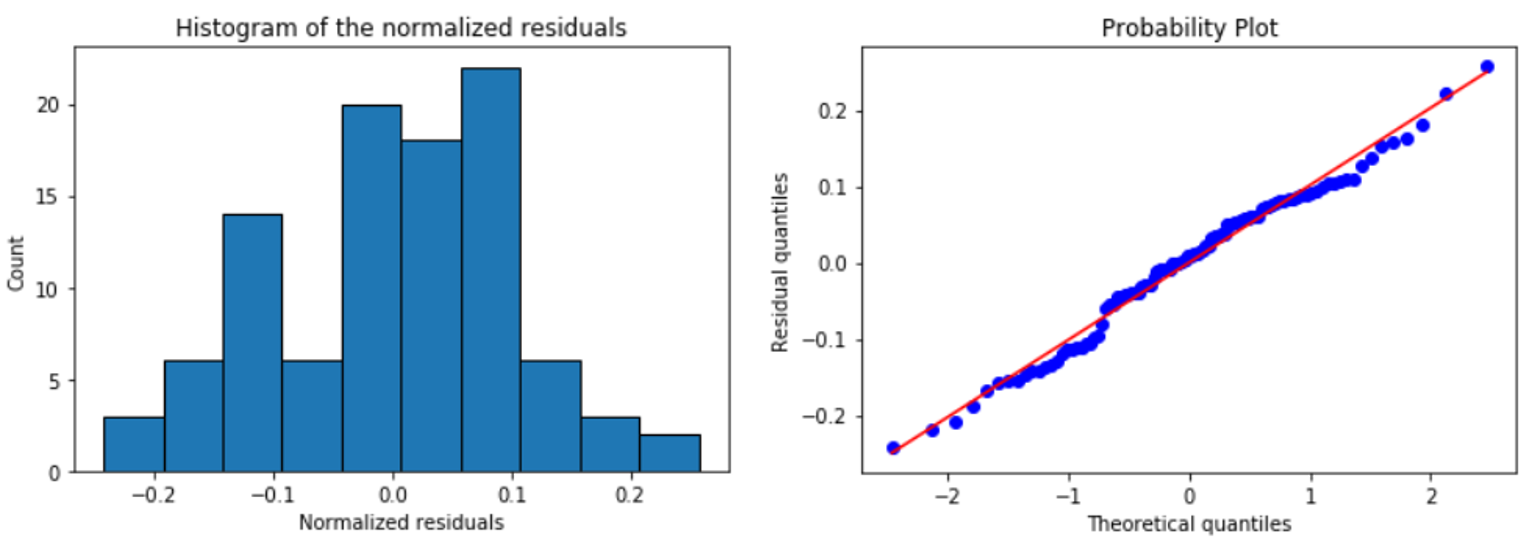
Again, the separation of code is at work here. You can modify and improve the core plotting utilities without touching the main class. Highly flexible and less error-prone approach!
Do more with the power of OOP
We will not elaborate further on the various utility classes and methods we can add to MyLinearRegression. You can check the Github repo.
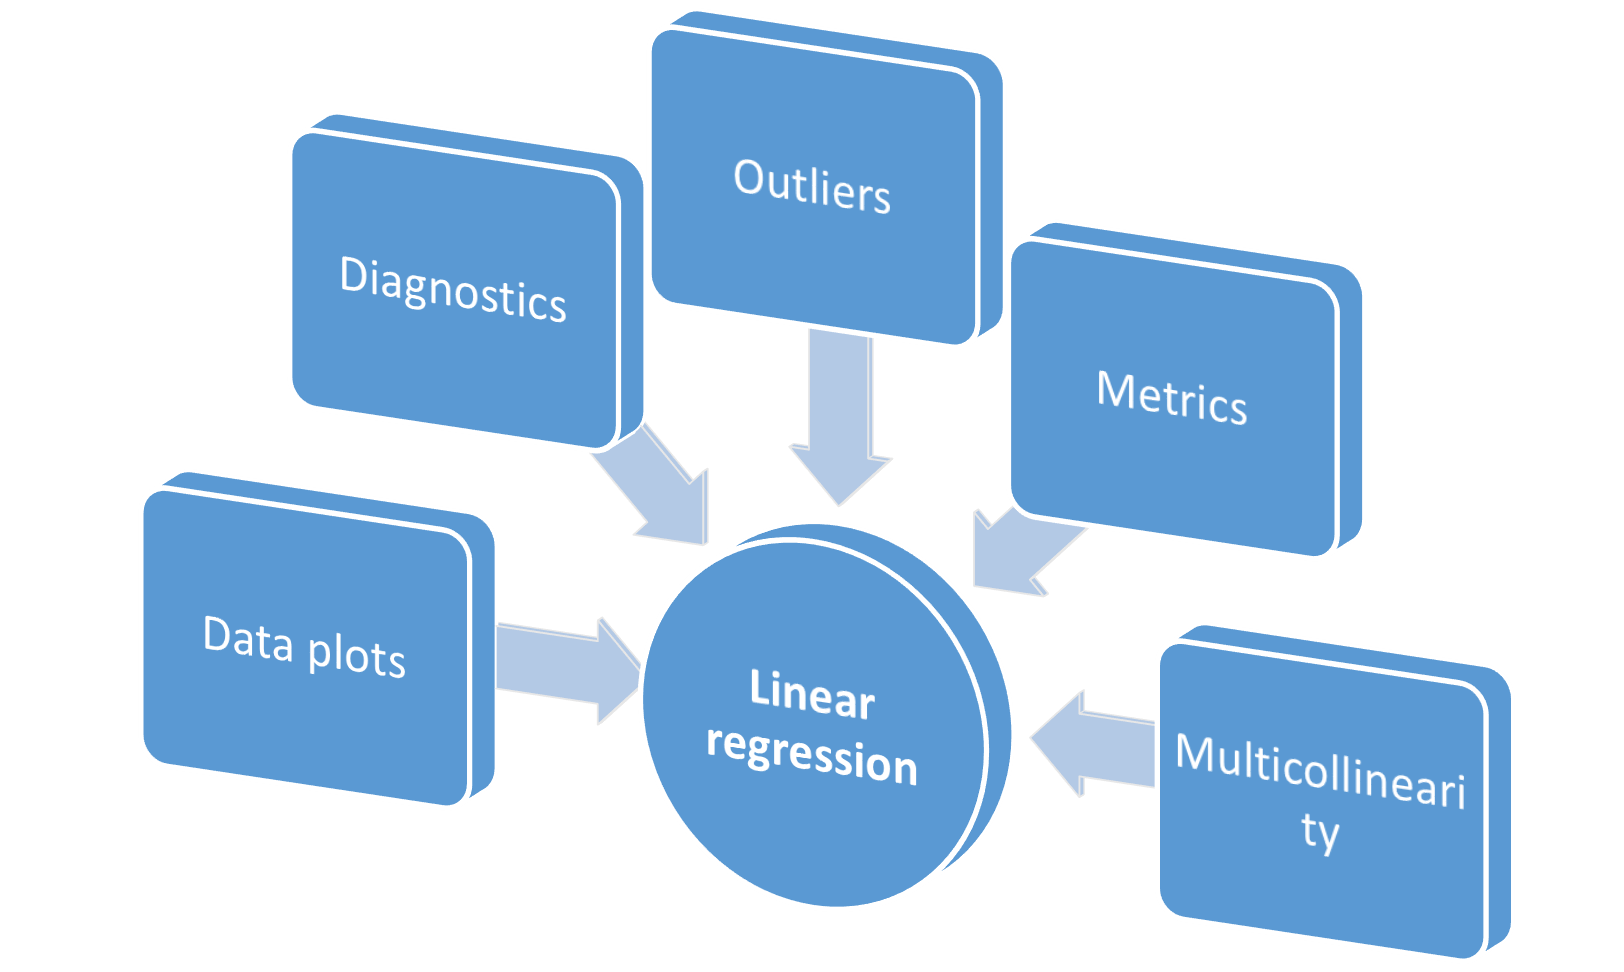
Additional classes added
Just for completeness, we added,
- A class
Metricsfor computing various regression metrics — SSE, SST, MSE, R², and Adjusted R². - A class
Outliersto plot Cook’s distance, leverage, and influence plots - A class
Multicollinearityto compute variance inflation factors (VIF)
All in all, the grand scheme looks like following,
Is this class richer than the Scikit-learn’s LinearRegression class? You decide.
Add syntactic sugar by creating grouped utilities
Once you have inherited other classes, they behave just like the usual Python module you are familiar with. So, you can add utility methods to the main class to execute multiple methods from a sub-class together.
For example, the following method runs all the usual diagnostics checks at once. Note how we are accessing the plot methods by putting a simple .DOT i.e. Diagnostics_plot.histogram_resid. Just like accessing a function from Pandas or NumPy library!
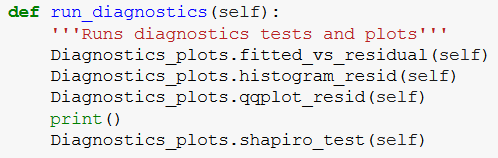
run_diagnostics method in the main class
With this, we can run all the diagnostics with a single line of code after fitting data.
m = MyLinearRegression() # A brand new model instance
m.fit(X,y) # Fit the model with some datam.run_diagnostics()
Similarly, you can add all the outlier plots in a single utility method.
Modularization — import the class as a module
Although not a canonical OOP principle, the essential advantage of following the OOP paradigm is to be able to modularize your code.
You can experiment and develop all this code in a standard Jupyter notebook. But for maximum modularity, consider converting the Notebook into a standalone executable Python script (with a .py extension). As a good practice, remove all the unnecessary comments and test code from this file and keep only the classes together.
Here is the link to the script I put together for this article.
Once you do that, you can import the MyLinearRgression class from a completely different Notebook. This is often the preferred way of testing your code as this does not touch the core model but only tests it with various data samples and functional parameters.
At this point, you can consider putting this Python script on a Github, creating a Setup.py file, creating the proper directory structure, and releasing it as a standalone linear regression package which does fitting, prediction, plotting, diagnostics, and more.
Of course, you have to add a lot of docstring description, examples of usage of a function, assertion checks, and unit tests to make it a good package.
But as a data scientist, now you have added a significant skill to your repertoire - software development following OOP principles.
It was not so difficult, was it?
Epilogue
Motivation and related articles
To write this post, I was inspired by this fantastic article, which drills down to the concept of OOP in Python in more detail with a context of machine learning.
Understanding Object-Oriented Programming Through Machine Learning
Object-Oriented Programming (OOP) is not easy to wrap your head around. You can read tutorial after tutorial and sift…
I wrote a similar article, touching even more basic approaches, in the context of deep learning. Check it out here,
How a simple mix of object-oriented programming can sharpen your deep learning prototype
By mixing simple concepts of object-oriented programming, like functionalization and class inheritance, you can add…
Courses?
I tried to look for relevant courses and found little if you are using Python. Most software engineering courses out there are taught using Java. Here are two which may be of help,
If you have any questions or ideas to share, please contact the author at tirthajyoti[AT]gmail.com. Also, you can check the author’s GitHub repositories for other fun code snippets in Python, R, or MATLAB and machine learning resources. If you are, like me, passionate about machine learning/data science, please feel free to add me on LinkedIn or follow me on Twitter.
Original. Reposted with permission.
Related:
- How a simple mix of object-oriented programming can sharpen your deep learning prototype
- Mathematical programming — Key Habit to Build Up for Advancing Data Science
- Optimization with Python: How to make the most amount of money with the least amount of risk?