Fast and Intuitive Statistical Modeling with Pomegranate
Pomegranate is a delicious fruit. It can also be a super useful Python library for statistical analysis. We will show how in this article.
What is Pomegranate?
First and foremost, it is a delicious fruit.

But there is a double delight for fruit-lover data scientists!
It is also a Python package that implements fast and flexible probabilistic models ranging from individual probability distributions to compositional models such as Bayesian networks and Hidden Markov Models.
The central idea behind this package is that all probabilistic models can be viewed as a probability distribution. That means they all yield probability estimates for samples and can be updated/fitted given samples and their associated weights. The primary consequence of this realization is that the implemented classes can be stacked and chained more flexibly than those available from other common packages.
What’s different from Scipy or Numpy?
This is a fair question. However, you will see that the implemented classes in the Pomegranate package are super intuitive and have uniform interfaces although they cover a wide range of statistical modeling aspects,
- General distributions
- Markov chains
- Bayesian networks
- Hidden Markov Models
- Bayes classifier
It is like having useful methods from multiple Python libraries together with a uniform and intuitive API.
Let us see some cool usage of this nifty little package.
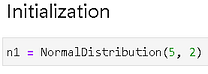
Probability distributions
Let is initialize with a NormalDistribution class.
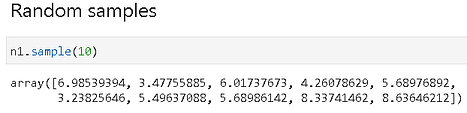
Generate a few samples,
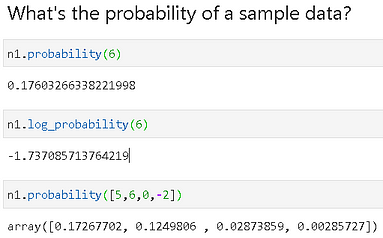
We can, now, easily check the probability of a sample data point (or an array of them) belonging to this distribution,
Fitting data
This is where it gets more interesting. Fitting with a data sample is super easy and fast.
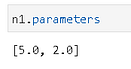
As initialized above, we can check the parameters (mean and std. dev) of the n1 object. We expect them to be 5.0 and 2.0.
Now, let us create some synthetic data by adding random noise to a Gaussian.
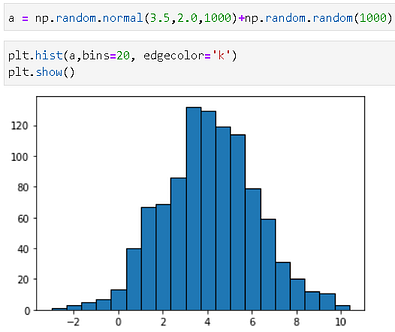
We can fir this new data to the n1 object and then check the estimated parameters.
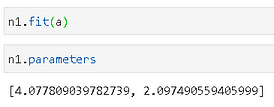
Phew! It looks like that n1 has updated its estimated mean and std.dev parameters to match with the input data now. The peak of the histogram is close to 4.0 from the plot and that’s what the estimated mean shows.
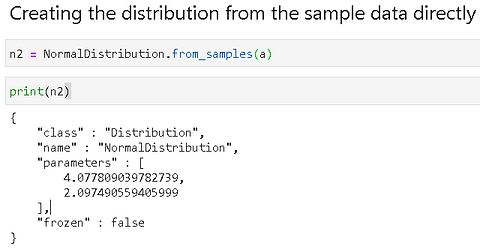
Create the distribution directly from a data sample
We showed how to fit data to a distribution class. Alternatively, one can create the object directly from the data,
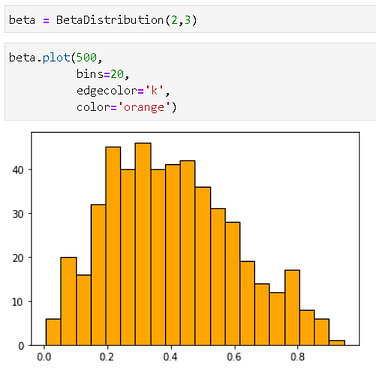
Plotting (histogram) is natively supported
Plotting is easy on the distribution class with the `plot()` method, which also supports all the keywords for a Matplotlib histogram method. We illustrate by plotting a Beta distribution object.
Discrete distribution
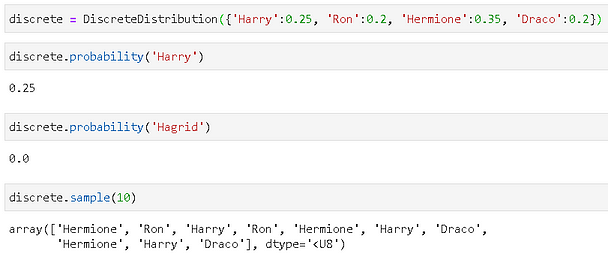
This is where it gets more interesting. Instead of passing parameters to a known statistical distribution (e.g. Normal or Beta), you can pass in a dictionary where keys can be any objects and values are the corresponding probabilities.
Here is an illustration with some Hogwarts characters. Note, when we try to calculate the probability of ‘Hagrid’, we get a flat zero because the distribution does not have any finite probability for the ‘Hagrid’ object.
Fitting data to a discrete distribution
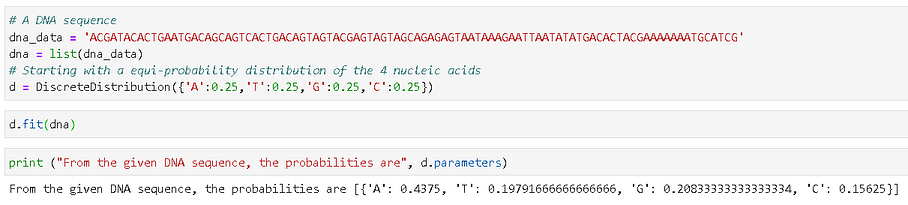
We can do much more interesting things by fitting data to a discrete distribution object. Here is an example with a fictitious DNA nucleic acid sequence. It is common to have this type of sequence data in a string, and we can read the data and calculate the probabilities of the four nucleic acids in the sequence with simple code.
A simple DNA sequence matching application
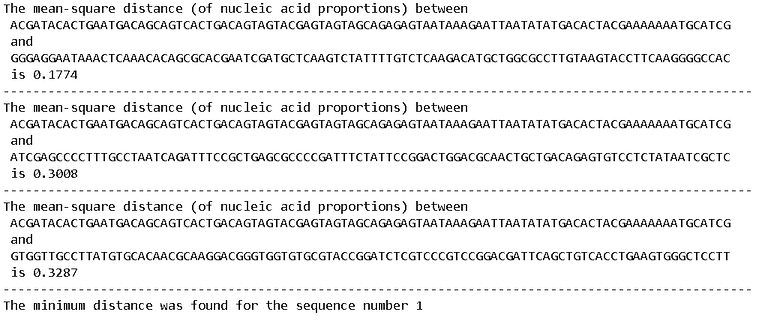
We can write an extremely simple (and naive) DNA sequence matching application in just a few lines of code. The assumption is that the sequences, which have similar frequencies/probabilities of nucleic acids, are closer to each other. Somewhat arbitrarily, we choose to calculate the root-mean-square-distance for this distance metric.
You can look at the Jupyter notebook for the helper function and the exact code, but here is a sample output.
Gaussian Mixture Models
Pomegranate makes working with data, coming from multiple Gaussian distributions, easy.
Let’s create some synthetic data,
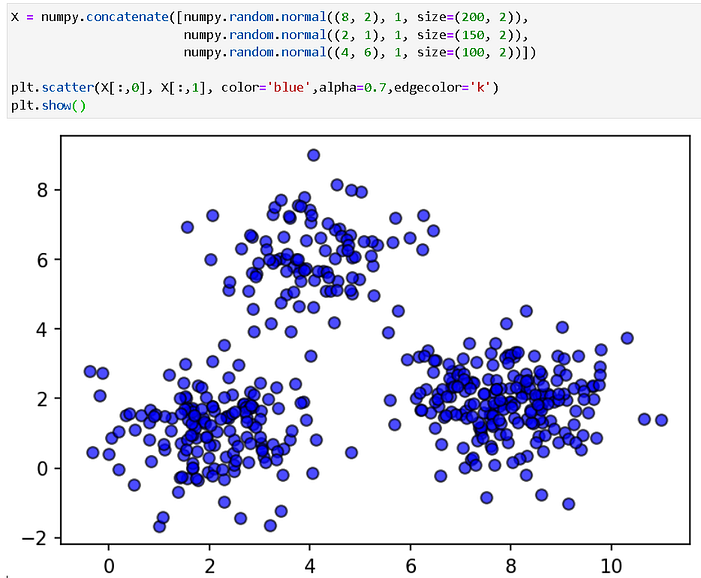
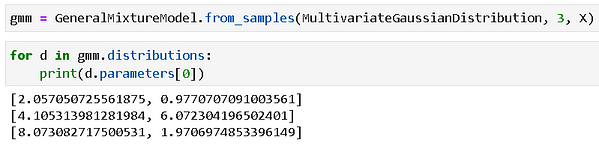
As usual, we can create a model directly from the data with one line of code. When we print the estimated parameters of the model, we observe that it has captured the ground truth (the parameters of the generator distributions) pretty well.
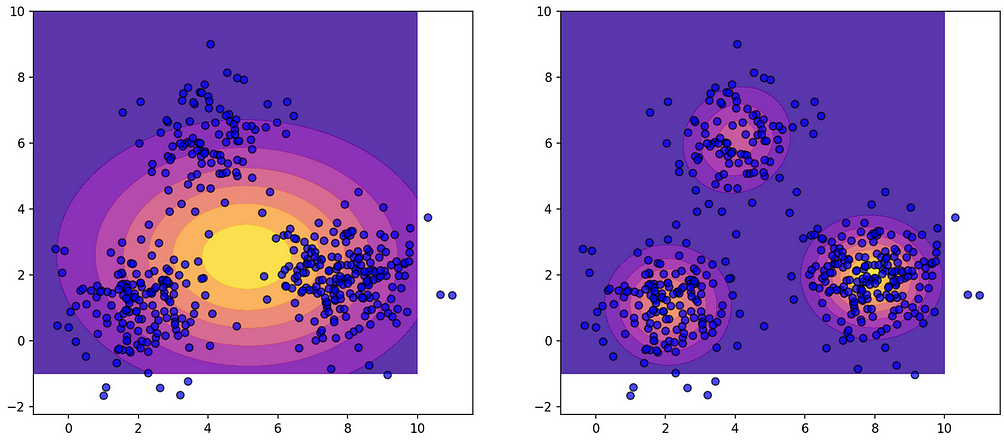
Once the model is generated with data samples, we can calculate the probabilities and plot them easily. The code is in the Notebook, here is the illustrative plot — the left side shows a single Gaussian, and the right-side shows a Mixture Model.
Markov Chain
We can easily model a simple Markov chain with Pomegranate and calculate the probability of any given sequence.
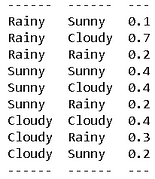
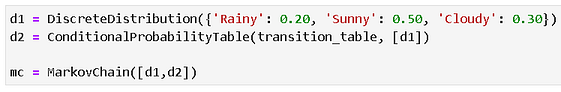
We will have the quintessential rainy-cloudy-sunny example for this one. Here is the transition probability table,
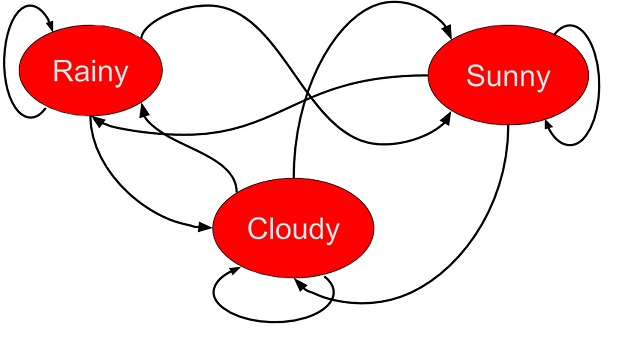
We also know that, on average, there are 20% rainy days, 50% sunny days, and 30% cloudy days. We encode both the discrete distribution and the transition matrix in the MarkovChain class,
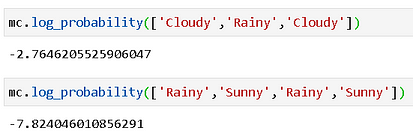
Now, we can calculate the probability of any given sequence using this object. For example, if you look at the table above, you can convince yourself that a sequence like “Cloudy-Rainy-Cloudy” has a high likelihood whereas a sequence like “Rainy-Sunny-Rainy-Sunny” is unlikely to show up. We can confirm this with precise probability calculations (we take logarithm to handle small probability numbers),
Fitting data to a GMM class
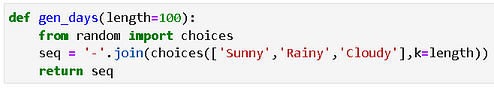
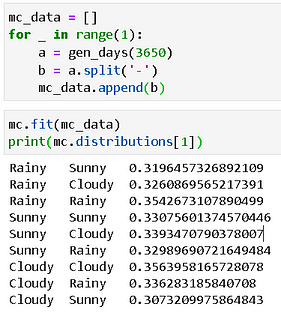
We write a small function to generate a random sequence of rainy-cloudy-sunny days and feed that to the GMM class.
First, we feed this data for 14 days’ observation— “Rainy-Sunny-Rainy-Sunny-Rainy-Sunny-Rainy-Rainy-Sunny-Sunny-Sunny-Rainy-Sunny-Cloudy”. The probability transition table is calculated for us.
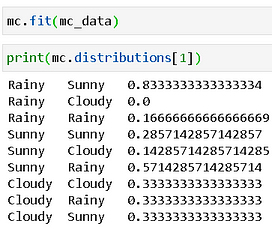
If we generate a random sequence of 10 years i.e. 3650 days, then we get the following table. Because our random generator is uniform, as per the characteristic of a Markov Chain, the transition probabilities will assume limiting values of ~0.333 each.
Hidden Markov Model
There are a lot of cool things you can do with the HMM class in Pomegranate. Here, we just show a small example of detecting the high-density occurrence of a sub-sequence within a long string using HMM predictions.
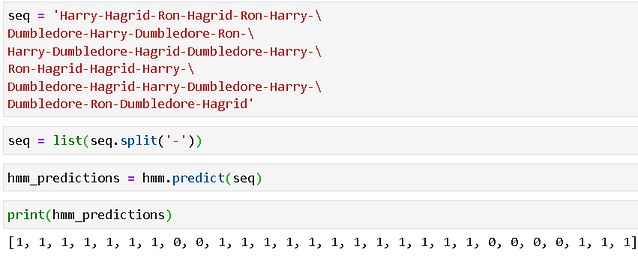
Let’s say we are recording the names of four characters in a Harry Potter novel as they appear one after another in a chapter, and we are interested in detecting some portion where Harry and Dumbledore are appearing together. However, because they may be conversing and may mention Ron or Hagrid’s names in these portions, the sub-sequence is not clean i.e. it does not strictly contain Harry and Dumbledore’s names.

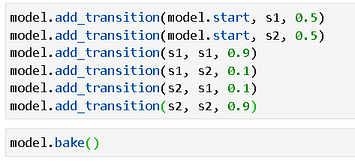
Following code initiates a uniform probability distribution, a skewed probability distribution, two states with names, and the HMM model with these states.

Then, we need to add the state transition probabilities and ‘bake’ the model for finalizing the internal structure. Note the high self-loop probabilities for the transition i.e. the states tend to stay in their current state with high likelihood.
Now, we have an observed sequence and we will feed this to the HMM model as an argument to the predict method. The transition and emission probabilities will be calculated and a sequence of 1’s and 0’s will be predicted where we can notice the island of 0’s indicating the portion rich with the appearance of ‘Harry-Dumbledore’ together.
Summary
In this article, we introduced a fast and intuitive statistical modeling library called Pomegranate and showed some interesting usage examples. Many more tutorials can be found here. Examples in this article were also inspired by these tutorials.
Pomegranate Tutorials from their Github repo
The library offers utility classes from various statistical domains — general distributions, Markov chain, Gaussian Mixture Models, Bayesian networks — with uniform API that can be instantiated quickly with observed data and then can be used for parameter estimation, probability calculations, and predictive modeling.
You can check the author’s GitHub repositories for code, ideas, and resources in machine learning and data science. If you are, like me, passionate about AI/machine learning/data science, please feel free to add me on LinkedIn or follow me on Twitter.
Tirthajyoti Sarkar - Sr. Principal Engineer - Semiconductor, AI, Machine Learning
Making data science/ML concepts easy to understand through writing
Original. Reposted with permission.
Related:
- Overview of data distributions
- Before Probability Distributions
- Comparing Machine Learning Models: Statistical vs. Practical Significance