The Best Tool for Data Blending is KNIME
These are the lessons and best practices I learned in many years of experience in data blending, and the software that became my most important tool in my day-to-day work.
By Dennis Ganzaroli, Data Scientist and Head of Report & Data-Management

Data is everywhere,… but who is able to handle the right data?
Data is everywhere in our new interconnected global world. It is captured in almost every aspect of our lives — groceries we purchase, websites we visit and opinions we share. As the importance of the data continues to growth so does the use of this data by organizations to better understand their customers, optimize their promotions, and much more.
Business and Data analysts have become the main driving force to answer more complex business questions.
Many analysts find it difficult to address this new data challenge because their traditional tools and approaches are not efficient enough to handle this new situation. Utilizing spreadsheets like Excel, manual processes and custom scripting are all too time-consuming and complicated in the face of the number of ad-hoc requests that analysts receive each day.
But management expectations are growing day by day so as the competition on the market increases furthermore.

What is Data Blending?
Data Blending is different from data integration, because it’s about solving a specific use case, whereas data integration typically gives you a single source of truth and stores it in a data warehouse for people to access.
In traditional data integration processes, also known as extract, transform and load (ETL) processes, data is extracted from multiple databases, transformed into a normalized format for analysis and loaded into a data warehouse where business analysts can slice and dice it with OLAP Tools like for example Microstrategy or IBM Cognos.
Data Blending
Data blending is the process of collecting data from multiple sources and merging it into one easily consumable dataset for further analysis. The goal is to extract valuable information to help for example leaders to make better decisions.
The problem with this approach is that the IT department, rather than business analysts, is in charge of the ETL process. This setup ensures that ETL is industrialized, scheduled and centrally governed. But what happens if an analyst needs to combine data sources as quickly as possible? IT can’t invent and execute a new ETL process every time an analyst needs to combine data sources. There is not much flexibility left in a tightly packed roadmap or Program Increment (PI) planning.

So what are the alternatives for the business analyst to achieve his goals within the set deadlines?
Learning the right thing
I remember years ago when a friend of mine took a training course in Visual Basic for Applications (VBA). He wanted to improve his programming skills to get things done faster. He spent 5 days and about 3000 euros to learn the basics of this scripting language.
Was he faster at solving his data blending tasks afterwards? — No at all! Instead, he sank into self-doubt and frustration and his problems were still not solved at all.
Therefore he asked me if I could support him with VBA. At the first moment I tried, but then I suggested him to try KNIME. His unit didn’t have the budget to buy a SAS or SPSS modeler license and KNIME was the next best alternative since it was also open source.
Starting over again without taking a class seemed like an impossible challenge to him. But after only a week he managed to solve his task.
He proudly showed me his solution and from that moment on his work pace changed completely.
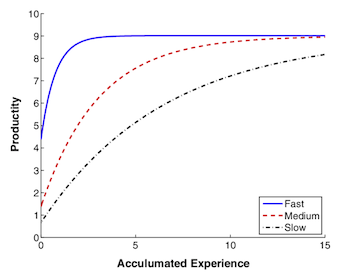
The Learning Curve
A visual-based GUI-tool can be learned and applied in less time than a script based programming language. Saving precious time and resources for more important investigations.
The evolution of visual programming languages
But let’s start from the beginning on: It was the 90s and I had just started my studies, when I discovered a programming language in the computer science lecture, which fascinated me from the beginning:
It was Prograph for the Mac. (by the way there is a great article on Prograph from Noel Rappin on medium)
Prograph was extremely intuitive and much less susceptible to syntax problems that textual languages and I saw a great potential for this approach
especially in the application for data analysis .
It was the time when I just started writing my first research papers, and I had to do a lot of data analysis.
A few years later my dreams came true: in 1994, SPSS presented the first version of Clementime (today’s IBM SPSS Modeler).

This was a completely game changer. It was possible to load data from Excel-, csv-Files or to query it with SQL from different databases and to join, transpose, transform and enrich it without the need for coding.
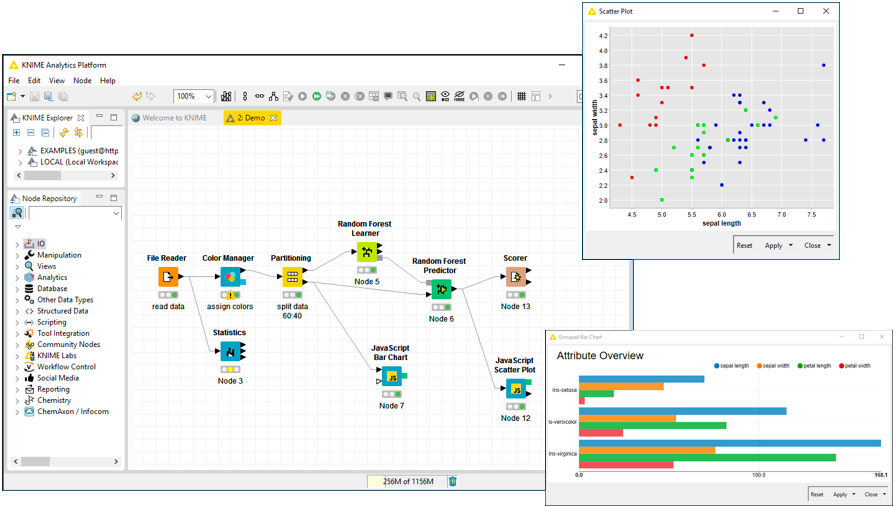
Every business analyst was suddenly able to build pipelines (workflows) and even to create predictive models (back then they were called data mining models) by drag&drop dedicated blocks (nodes) in the Graphical User Interface (GUI).
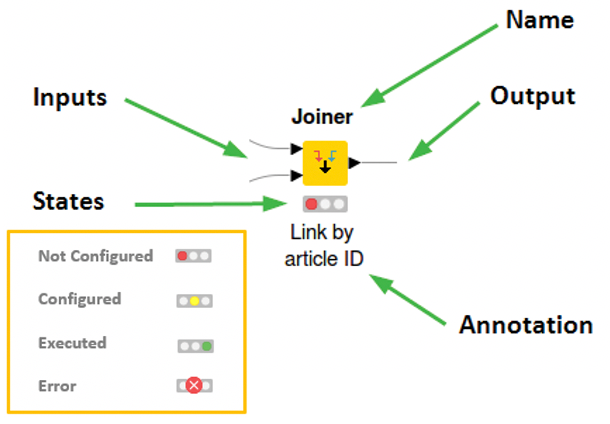
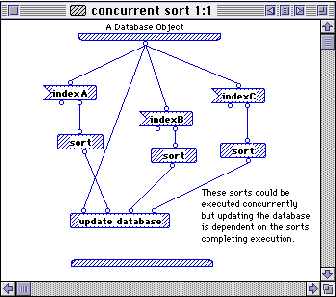
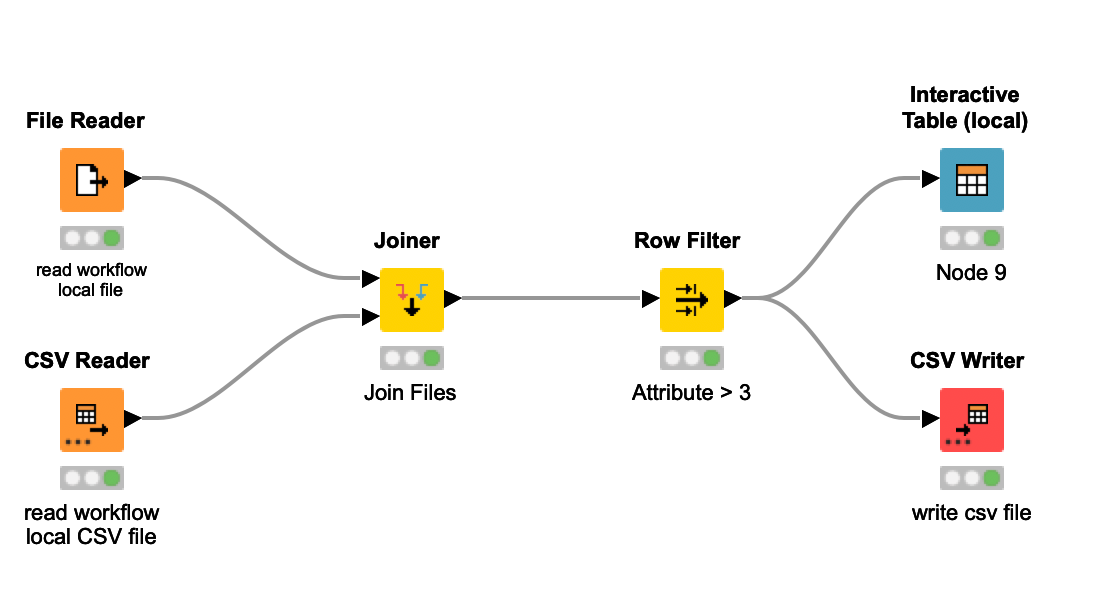
Each node implemented a specific task such as a row filter a grouping by or joiner like in the image above,
A workflow substituted a script and a node substituted one or more script lines. Node after node, the pipeline was quickly built, configured, executed, inspected, and documented. And you did’t have to reinvent the wheel every time as the workflows were reusable.
-> There was only a problem: The license was horrendously expensive.
So one question quickly arose: How do you get this software?
The answer was quite easy: try to work for a company that has the licenses already. But what you gonna do if your company is not able to afford it?
Are you then still able to deliver?
License costs are of vital importance
If you’re not able to afford it, you will not be able to deliver. That’s why an open source solution is often the better alternative. The tool may not be the latest in GUI, but when you have a large community behind it, your work is on solid ground.
Why KNIME?
A few years of great experiences with Clementine followed. It was 2004 and I was working at that time at SPSS when I discovered KNIME. A similar tool like Clementine but open source and therefore affordable for everyone.
When I went to my boss to tell him about this tool, he already knew about it but just showed me to shut up. Nobody should know about it.
Years later working for another company, I moved to a newly created business unit. Although it was a large company there was no budget for any data blending tools like SPSS Modeler or SAS for that unit. So I decided to try KNIME again. But this time in a productive environment.
7 years have passed since then. And I have to say, it was one of the best decisions of my professional career!
But what where the key reasons for this successful choice? Here are the most important ones:
Automating repetitive tasks with a easy-to-learn scripting language
Our business analysts were working mostly of the time with Microstrategy from where they exported files in Excel for further processing. They were great at Excel engineering, but as the volume of data grew more and more and the data sources became more diverse, they quickly reached the limits of their capabilities. A simple join with two datasets became an horror trip and the transformation of columns in Excel was in certain cases simply too complicated. But the most frustrating thing was when the file format changed and everything in the Excel file stopped working.
So we had to implement an other approach to get things done.
The visual programming language of KNIME is self-explanatory and therefore easy to learn. Our business analysts were quickly able to use the software productively. After just a few weeks of practice, they were able to work with the new tool without much help.
Sourcing every data source from anywhere
Accessing a data warehouse via SQL is certainly one of the fastest ways to get the data you need. But it’s not always possible. Sometimes a new API must be built or there are other restrictions. But the management has no time to wait for such implementations. So you have to done the dirty job and export sometimes the data from a front-end tool like Sales Force, SAP or Microstrategy and import it again in KNIME for further processing. And even if it is not the most elegant solution, it often solves the most problems. Unfortunately, there is the manual task of exporting the data, but after that everything is automated and fast. For monthly and weekly reports it’s usually sufficient.
Easy documentation and collaboration
A well-documented workflow will save your life if the owner of it is on vacation, for example and your boss needs immediately the results.
But what makes a good documentation?
The best documentation is the one that is not necessary. You see the workflow and you realize very quick the concept behind. (ok, sometimes people mess it up anyway, so not even the use of KNIME can help.)
This also makes collaboration much more agreeable, because you can easily divide the work into different reusable tasks and put them back together again at the end. And everybody has the same understanding of the content.
Automating workflows
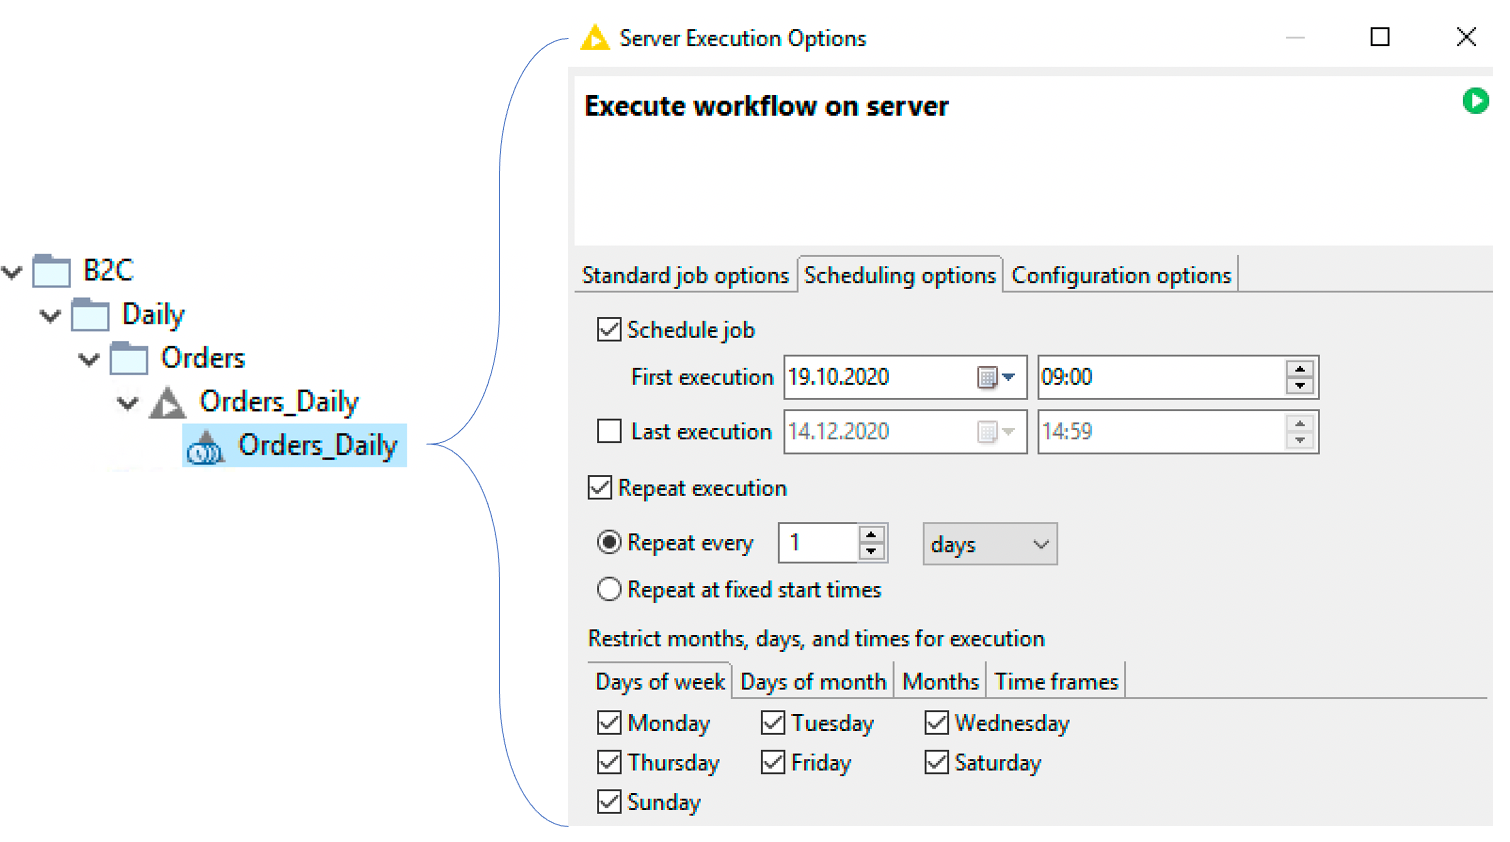
It comes the day when weekly reports are not enough anymore and the management wants a daily update of the business performance. Meanwhile the IT has built the API. So you can directly source the data from the warehouse, transform it and report it with a workflow which executes every day in the morning at the same time. You get an email when the job is completed and the data or the report ready is.
With the KNIME Server it’s possible to achieve this. You create a Workflow and publish it by drag & drop form the KNIME Client to the KNIME Server. Then you set a schedule for when the workflow must be executed. And so you get automatically your jobs done and free up time for your employees to take care of more analytical tasks. We also call our KNIME Server our robot co-worker because he always lets us save time.
A scalable platform for everybody and every use case
Not all of your employees will have the same level of skill, so their jobs may be very different. Your business analyst may just need to merge and process data from spreadsheets, while your data scientists need to build predictive models.
Therefore, they will be familiar with R (a statistical language) or Python, which have extensive libraries for various data science tasks. With the Python integration you can use your Python scripts directly in KNIME. The same is true for R and JavaScript. You can even call Jupyter notebooks in KNIME without to have a Jupyter Server running. I wrote already an article on the subject here.
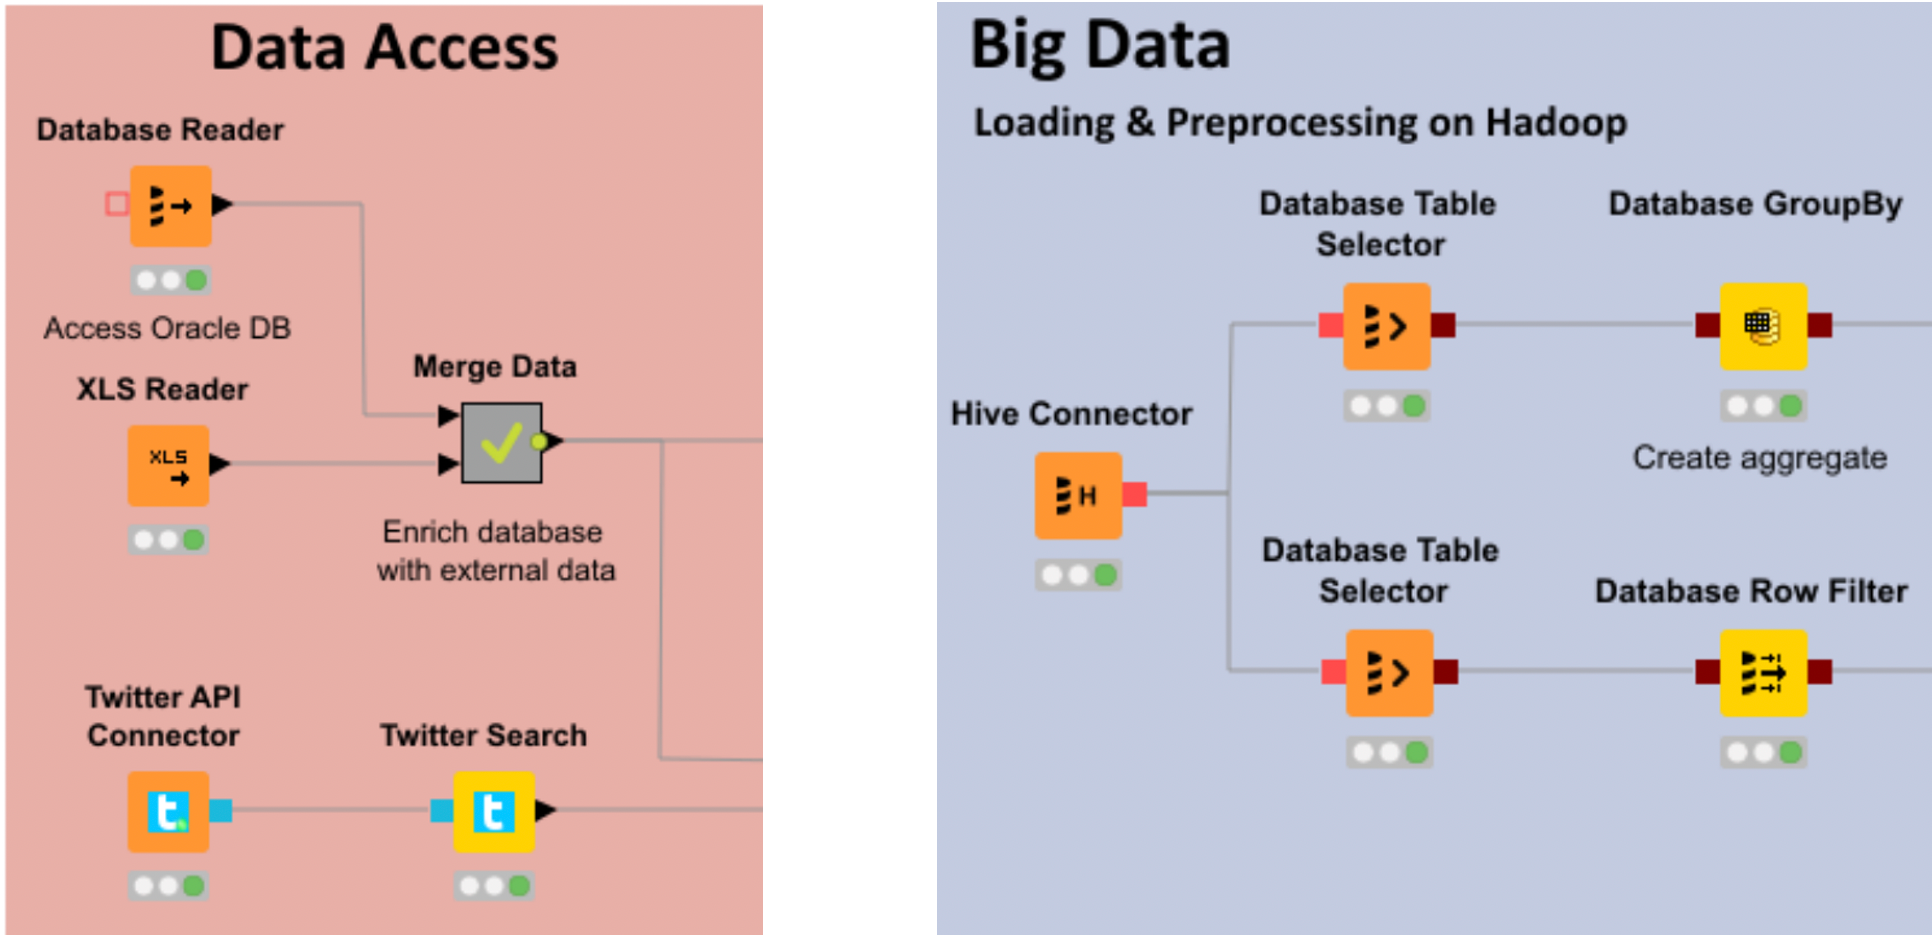
Coverage of BigData nodes with Spark, Hive, json and more is also provided and there is even a Deep Learning integration with nodes for Keras and Tensorflow. There’s a good introduction article on Medium from Rosaria Silipo with the title Codeless Deep Learning.
KNIME already comes with over 2000 native nodes and has a lot extensions for Text Mining, Big Data and so on. So it covers practically every aspect of data science: from gathering and wrangling data to making sense of it with sophisticated modeling and visualization techniques.

Today’s analysts must constantly stay up to date to keep their companies competitive. They need to focus their strengths on high-level business issues instead of wasting their time on low-level spreadsheets and SQL queries.
Data blending helps today’s analysts take full advantage of their expanding roles and KNIME is in my opinion the ideal tool for achieve this.
KNIME Software: Creating Data Science
Thanks for reading!
Please feel free to share your thoughts or reading tips in the comments.
Resources:
Follow me on Medium, Linkedin or Twitter
My Projects are on: KNIME-Hub, Tableau-Public and github
Bio: Dennis Ganzaroli is a Data Scientist and Head of Report & Data-Management at a big Telco in Switzerland.
Original. Reposted with permission.
Related:
- Why the Future of ETL Is Not ELT, But EL(T)
- Resampling Imbalanced Data and Its Limits
- Mastering Time Series Analysis with Help From the Experts