Implementing DBSCAN in Python
Density-based clustering algorithm explained with scikit-learn code example.
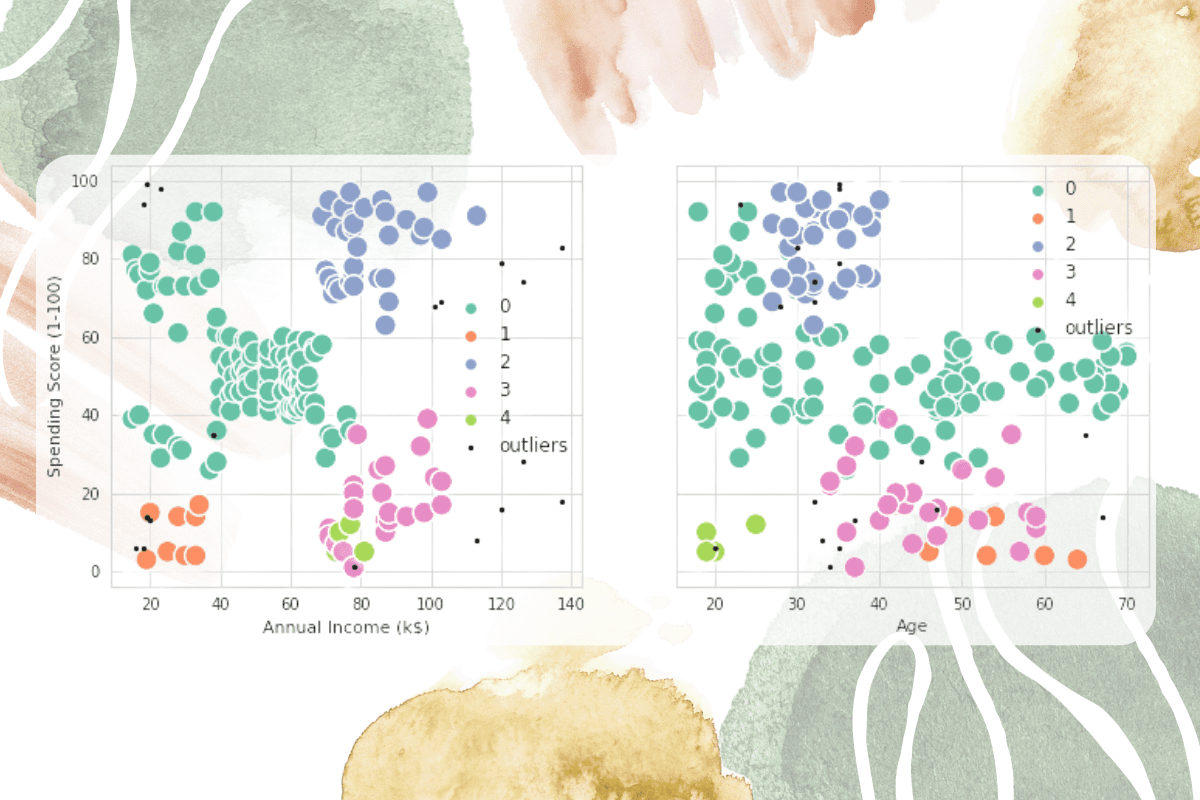
Image by Author
Clustering is applied on a dataset to group similar sets of data points. It looks for similarities and dissimilarities in data points and clutters them together. There are no labels in clustering. Clustering is an unsupervised learning to find the underlying structure of the dataset.
Types of clustering algorithms:
- Partition-based clustering
- Fuzzy clustering
- Hierarchical clustering
- Grid-Based clustering
- Exclusive clustering
- Overlapping clustering
- Density-based clustering
In this blog, we will be focusing on density-based clustering methods, especially the DBSCAN algorithm with scikit-learn. The density-based algorithms are good at finding high-density regions and outliers. It is commonly used for anomaly detection and clustering non-linear datasets.
What is DBSCAN?
DBSCAN (Density-Based Spatial Clustering of Applications with Noise) is a density-based unsupervised learning algorithm. It computes nearest neighbor graphs to find arbitrary-shaped clusters and outliers. Whereas the K-means clustering generates spherical-shaped clusters.
DBSCAN does not require K clusters initially. Instead, it requires two parameters: eps and minPts.
- eps: it is the radius of specific neighborhoods. If the distance between two points is less than or equal to esp, it will be considered its neighbors.
- minPts: minimum number of data points in a given neighborhood to form the clusters.
DBSCAN uses these two parameters to define a core point, border point, or outlier.
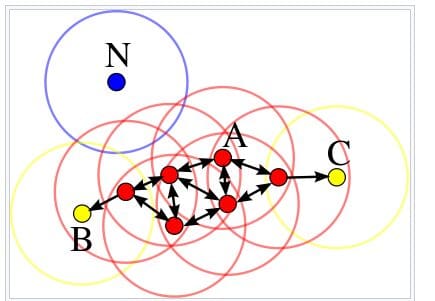
Image from Wikipedia
How does the DBSCAN clustering algorithm work?
- Randomly selecting any point p. It is also called core point if there are more data points than minPts in a neighborhood.
- It will use eps and minPts to identify all density reachable points.
- It will create a cluster using eps and minPts if p is a core point.
- It will move to the next data point if p is a border point. A data point is called a border point if it has fewer points than minPts in the neighborhood.
- The algorithm will continue until all points are visited.
DBSCAN Clustering in Python
We will be using the Deepnote notebook to run the example. It comes with pre-installed Python packages, so we just have to import NumPy, pandas, seaborn, matplotlib, and sklearn.
import numpy as np
import pandas as pd
import seaborn as sns
import matplotlib.pyplot as plt
from sklearn.cluster import DBSCAN
We are using Mall Customer Segmentation Data from Kaggle. It contains customers' age, gender, income, and spending score. We will be using these features to create various clusters.
First, we will load the dataset using pandas `read_csv`. Then, we will select three columns (‘Age', 'Annual Income (k$)', 'Spending Score (1-100)') to create the X_train dataframe.
df = pd.read_csv('Mall_Customers.csv')
X_train = df[['Age', 'Annual Income (k$)', 'Spending Score (1-100)']]
We will fit X_train on the DBSCAN algorithm with eps 12.5 and min_sample 4. After that, we will create a DBSCAN_dataset from X_train and create a ‘Cluster’ column using clustering.labels_.
clustering = DBSCAN(eps=12.5, min_samples=4).fit(X_train)
DBSCAN_dataset = X_train.copy()
DBSCAN_dataset.loc[:,'Cluster'] = clustering.labels_
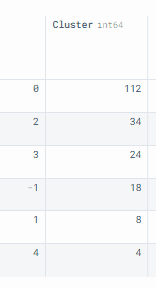
To visualize the distribution of clusters, we will use value_counts() and convert it into a dataframe.
As you can see, we have 5 clusters and 1 outlier. The `0` cluster has the largest size with 112 rows.
DBSCAN_dataset.Cluster.value_counts().to_frame()
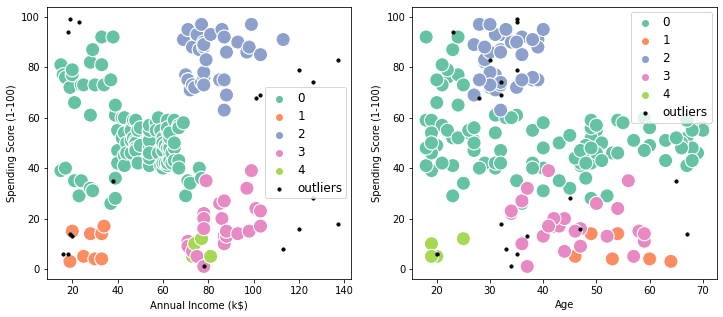
In this section, we will use the above information and visualize the scatter plot.
There are two plots: “Annual Income vs. Spending Score” and “Annual Income vs. Age.” The clusters are defined by colors, and the outliers are defined as small black dots.
The visualization clearly shows how each customer is part of one of the 5 clusters, and we can use this information to give high-end offers to customers with purple clusters and cheaper offers to customers with dark green clusters.
outliers = DBSCAN_dataset[DBSCAN_dataset['Cluster']==-1]

fig2, (axes) = plt.subplots(1,2,figsize=(12,5))

sns.scatterplot('Annual Income (k$)', 'Spending Score (1-100)',

                data=DBSCAN_dataset[DBSCAN_dataset['Cluster']!=-1],

                hue='Cluster', ax=axes[0], palette='Set2', legend='full', s=200)

sns.scatterplot('Age', 'Spending Score (1-100)',

                data=DBSCAN_dataset[DBSCAN_dataset['Cluster']!=-1],

                hue='Cluster', palette='Set2', ax=axes[1], legend='full', s=200)

axes[0].scatter(outliers['Annual Income (k$)'], outliers['Spending Score (1-100)'], s=10, label='outliers', c="k")

axes[1].scatter(outliers['Age'], outliers['Spending Score (1-100)'], s=10, label='outliers', c="k")
axes[0].legend()
axes[1].legend()

plt.setp(axes[0].get_legend().get_texts(), fontsize='12')
plt.setp(axes[1].get_legend().get_texts(), fontsize='12')

plt.show()
Conclusion
DBSCAN is one of the many algorithms that is used for customer segmentation. You can use K-means or Hierarchical clustering to get even better results. The clustering algorithms are generally used for recommendation engines, market and customer segmentation, social network Analysis, and document analysis.
In this blog, we have learned the basics of the density-based algorithm DBCAN and how we can use it to create customer segmentation using scikit-learn. You can improve the algorithm by finding optimal eps and min_samples using silhouette score and heatmap.
Reference
- DBSCAN Clustering — Explained. Detailed theoretical explanation
- DBSCAN in Python (with example dataset)
- Customers clustering: K-Means, DBSCAN and AP
- Demo of DBSCAN clustering algorithm — scikit-learn 1.1.1 documentation
Abid Ali Awan (@1abidaliawan) is a certified data scientist professional who loves building machine learning models. Currently, he is focusing on content creation and writing technical blogs on machine learning and data science technologies. Abid holds a Master's degree in Technology Management and a bachelor's degree in Telecommunication Engineering. His vision is to build an AI product using a graph neural network for students struggling with mental illness.