Harnessing ChatGPT for Automated Data Cleaning and Preprocessing
A guide to using ChatGPT for the tasks of data cleaning and preprocessing on a real-world dataset.

Image by Author
ChatGPT has become a swiss-army knife that can be used for multitude of applications, and there’s abundant scope to integrate ChatGPT into data science workflows.
If you’ve ever trained a machine learning model on a real-world dataset, you know that the steps of data cleaning and preprocessing are important for building robust machine learning models. In this guide, we’ll see how we can use ChatGPT to perform these tasks on an example dataset.
We’ll use the bank marketing dataset from the UCI machine learning repository and prompt ChatGPT to do the following:
- Fetch and load the dataset
- Check for missing values
- Encode categorical variables
You can follow along by signing in to your OpenAI account and starting a new ChatGPT session. If you prefer, you can also code along in Google Colab.
Fetching and Loading the Dataset
There are a few different versions of the dataset. We’ll use bank-full.csv.
Prompt: Today we’ll perform data cleaning and preprocessing on a real-world dataset. Write the code to do the following: 1. Fetch the bank marketing dataset from the UCI machine learning repository. Use libraries like requests or urllib. 2. Download the zip file, unzip the contents, and read in the bank-full.csv file into a pandas dataframe (call it data).
The code to fetch and read in the dataset is as follows:
import pandas as pd
import urllib
import zipfile

# URL of the dataset
url = "https://archive.ics.uci.edu/ml/machine-learning-databases/00222/bank.zip"

# Fetch and extract the dataset
urllib.request.urlretrieve(url, "bank.zip")

with zipfile.ZipFile("bank.zip", "r") as zip_ref:
    zip_ref.extractall()

# Load the dataset into a pandas DataFrame
data = pd.read_csv("bank-full.csv", delimiter=";",skipinitialspace=True)
Getting Basic Info on the Dataset
Let's understand the dataset better.
# Display the first few rows of the dataset
print(data.head())
This outputs:
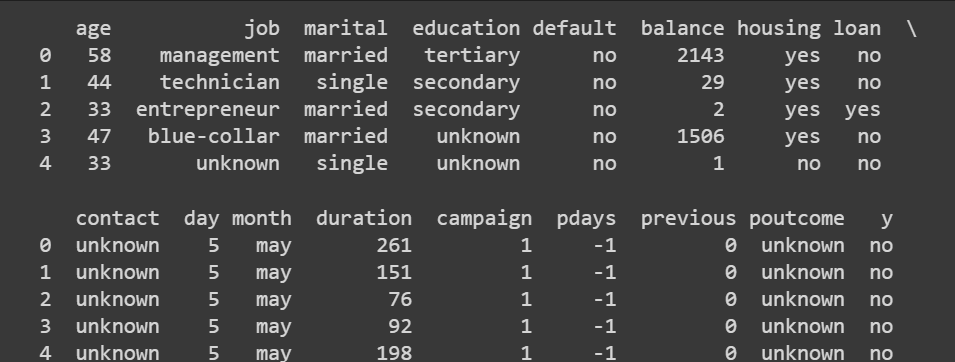
Truncated output of data.head()
Prompt: Use pandas to get the dimension of the dataframe, descriptive statistics on the columns, and data types of various columns.
This step doesn’t really require prompting ChatGPT as the pandas methods are pretty simple.
# Get the dimensions of the dataset (rows, columns)
print(data.shape)
Output >>> (45211, 17)
We have over 45000 records and 16 features (as 17 is inclusive of the output label as well).
# Get statistical summary of numerical columns
print(data.describe())

Truncated output of data.describe()
It’s also helpful to get an overview of the data types of the various columns. We’ll take a closer look at them when we encode categorical variables.
# Check data types of each column
print(data.dtypes)
Output >>>

age           int64
job          object
marital      object
education    object
default      object
balance       int64
housing      object
loan         object
contact      object
day           int64
month        object
duration      int64
campaign      int64
pdays         int64
previous      int64
poutcome     object
y            object
dtype: object
So far we’ve gained an understanding of the bank marketing dataset. The output label denotes whether or not a customer will subscribe to a term deposit. The dataset contains several features such as the age, month, education, marital status, outcome of previous campaigns, and more.
Checking for Missing Values
Prompt: I want to know the number of missing values in each column. Please give me the code to do it. Use pandas.
# Check for missing values in each column
missing_values = data.isnull().sum()
print(missing_values)
Here’s the output:
Output >>>

age          0
job          0
marital      0
education    0
default      0
balance      0
housing      0
loan         0
contact      0
day          0
month        0
duration     0
campaign     0
pdays        0
previous     0
poutcome     0
y            0
dtype: int64
This version of the bank marketing dataset—with over 45000 records—does not have any missing values. In practice, though, most real-world datasets have missing values. You should handle missing values using suitable imputation techniques.
As an optional exercise , you can add a step here prompting ChatGPT to drop a small fraction of values from a subset of columns so you can practice how to handle missing values.
Encoding Categorical Variables
The next step is to encode categorical variables in the dataset. We’ll start by getting the list of all categorical columns.
Prompt: Give the code to get the list of all categorical columns in this dataset.
# Count the number of categorical variables
categorical_columns = data.select_dtypes(include=['object']).columns
print(categorical_columns)
num_categorical_variables = len(categorical_columns)

# Display the count
print("Number of categorical variables:", num_categorical_variables)
The categorical columns list also includes the output label y. But let's focus on the other categorical variables first.
Output >>>
Index(['job', 'marital', 'education', 'default', 'housing', 'loan', 'contact',
       'month', 'poutcome', 'y'],
      dtype='object')
Number of categorical variables: 10
A Closer Look at the Values of Categorical Variables
Next, let’s see the values that each categorical variable takes.
Prompt: I want to understand the various values that each categorical variable takes. Give the pandas code to do it.
# Get the different values and their counts for each categorical column
categorical_columns = ['job', 'marital', 'education', 'default', 'housing', 'loan', 'contact', 'month', 'poutcome']
for column in categorical_columns:
    value_counts = data[column].value_counts()
    print(f"Column: {column}")
    print(value_counts,"\n")
The output is hard to parse:
Output >>>

Column: job
blue-collar      9732
management       9458
technician       7597
admin.           5171
services         4154
retired          2264
self-employed    1579
entrepreneur     1487
unemployed       1303
housemaid        1240
student           938
unknown           288
Name: job, dtype: int64

...
...
...
Column: poutcome
unknown    36959
failure     4901
other       1840
success     1511
Name: poutcome, dtype: int64
Visualizing the Values of Categorical Variables
Let’s prompt ChatGPT to create a visualization so it’s easier to understand what values the categorical variables take.
Prompt: I want a plot that shows the values that each categorical variable takes. Exclude the output label y. Include all other categorical variables.
And here we go!
import matplotlib.pyplot as plt

# Get the different values and their counts for each categorical column
categorical_columns = ['job', 'marital', 'education', 'default', 'housing', 'loan', 'contact', 'month', 'poutcome']

# Set up the subplot grid
fig, axes = plt.subplots(3, 3, figsize=(10,8))

# Iterate over each categorical column and plot the value counts
for i, column in enumerate(categorical_columns):
    row = i // 3
    col = i % 3
    value_counts = data[column].value_counts()
    ax = axes[row, col]
    value_counts.plot(kind='bar', ax=ax)
    ax.set_xlabel(column)
    ax.set_ylabel('Count')
    ax.set_title(f'{column.title()} Value Counts')

# Adjust spacing between subplots
plt.tight_layout()

# Show the plot
plt.show()
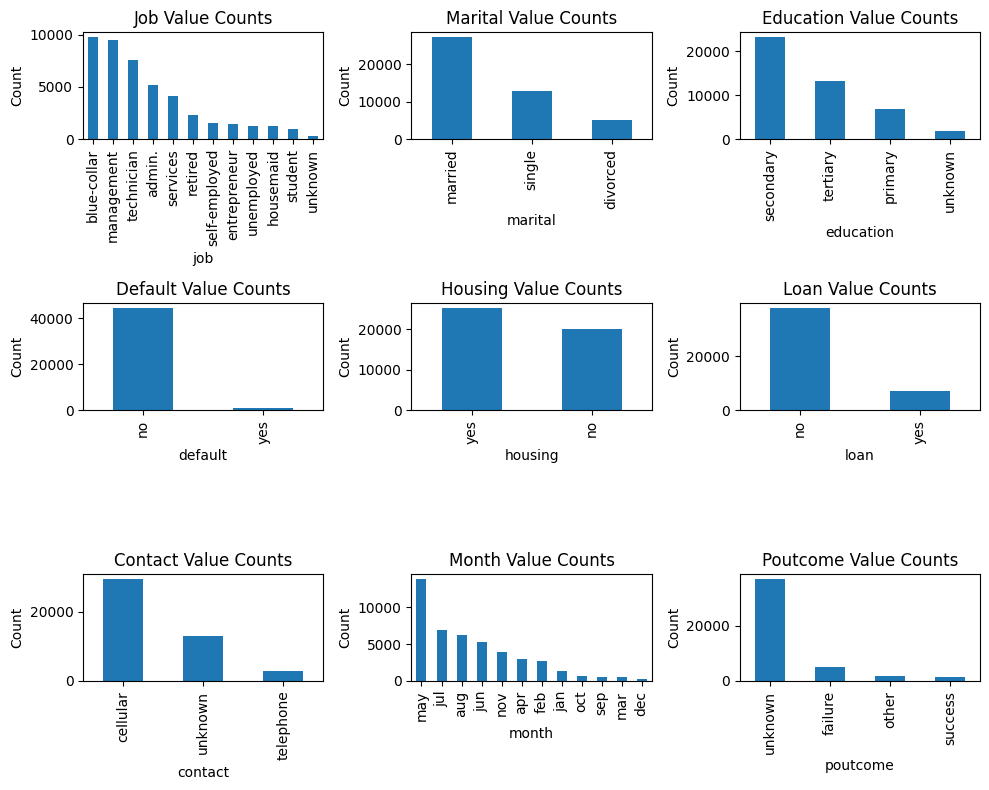
Values of Categorical Variables
One-Hot Encoding
For a subset of categorical columns, we can use one-hot encoding.
Prompt: Give the pandas code to perform one-hot encoding for a list of columns.
We use get_dummies from pandas to one-hot encode the following columns:
# Select the categorical columns (excluding education and poutcome)
categorical_columns = ['job', 'marital', 'default', 'housing', 'loan', 'contact']

# Perform one-hot encoding
encoded_data = pd.get_dummies(data, columns=categorical_columns)
Prompt: I want to print out the first few rows for the newly added columns. Write the code to do the same.
# Select the newly added columns
new_columns = encoded_data.columns.difference(data.columns)

# Print the head of the newly added columns
print(encoded_data[new_columns].head())
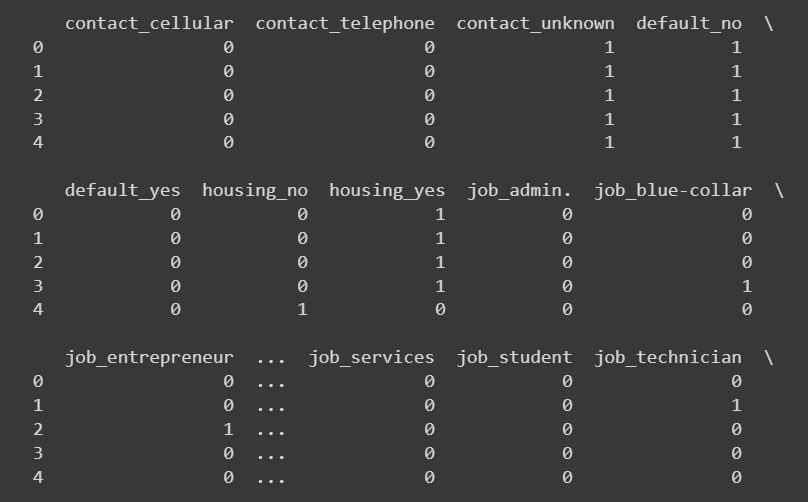
Truncated output of encoded_data['new_colums'].head()
Defining a Custom Mapping
For columns for variables like ‘education’ and ‘poutcome’ (previous outcome), rather than one-hot encoding, it would be better to use custom mapping to have a degree of comparison between the values.
Also, when we use one-hot encoding to encode a categorical variable that takes k distinct values k new columns. For a categorical column like ‘month’ this will be excessive without adding much information.
So for both of these cases, we will define a custom mapping and then transform the values. We can prompt ChatGPT to get a generic code snippet which we can then modify to define the mapping for the specific columns.
Prompt: I want to do a custom mapping for encoding some categorical variables. First give me a generic code snippet that defines a custom mapping from unique values in a categorical column to a different set of output values. We should then use this mapping to transform the values in the columns.
# Define the custom mapping dictionary
custom_mapping = {
    'category1': 'value1',
    'category2': 'value2',
    'category3': 'value3',
    # Add more categories and corresponding values as needed
}

# Specify the categorical column
categorical_column = 'column_name'  # Replace 'column_name' with the actual column name

# Perform the mapping using the custom mapping dictionary
data[categorical_column] = data[categorical_column].map(custom_mapping)
For the ‘month’ column, let us transform the month strings like so:
# Define the mapping dictionary for months
month_mapping = {
    'jan': 1,
    'feb': 2,
    'mar': 3,
    'apr': 4,
    'may': 5,
    'jun': 6,
    'jul': 7,
    'aug': 8,
    'sep': 9,
    'oct': 10,
    'nov': 11,
    'dec': 12
}

# Map the values in the month column
encoded_data['month'] = encoded_data['month'].map(month_mapping)
Let’s map the ‘poutcome’ and ‘education’ columns to numerical values as shown:
# Define the custom mapping for poutcome and education
poutcome_mapping = {
    'unknown': 0,
    'failure': 1,
    'other': 2,
    'success': 3
}

education_mapping = {
    'unknown': 0,
    'primary': 1,
    'secondary': 2,
    'tertiary': 3
}

# Perform ordinal encoding using pandas map
encoded_data['poutcome'] = encoded_data['poutcome'].map(poutcome_mapping)
encoded_data['education'] = encoded_data['education'].map(education_mapping)


# Select the newly added columns
new_columns = ['month','poutcome', 'education']

# Print the head of the newly added columns
print(encoded_data[new_columns].head(10))
Encoding the Output Label
Let's also map the output labels 'yes' and 'no' to 1 and 0, respectively.
encoded_data['y'] = encoded_data['y'].replace({'no': 0, 'yes': 1})
print(encoded_data['y'])
Output >>>

0        0
1        0
2        0
3        0
4        0
        ..
45206    1
45207    1
45208    1
45209    0
45210    0
Name: y, Length: 45211, dtype: int64
Recall that we used one-hot encoding for ‘housing’, ‘default’, and ‘loan’ columns. Because these columns also take ‘yes’ and ‘no’ values, you can also map ‘yes’ and ‘no’ to 1 and 0, respectively.
Visualizing the Distribution of Class Labels
It’s also helpful to check the distribution of class labels so that we can account for class imbalance when building models if needed.
Prompt: I would like to understand the distribution of class labels. Please give me the code to generate a suitable plot for the same.
Here’s the code to generate a countplot in Seaborn:
import seaborn as sns
import matplotlib.pyplot as plt

# Plot the distribution of output labels
sns.countplot(data=data, x='y')
plt.xlabel('Output Label')
plt.ylabel('Count')
plt.title('Output Label Distribution')
plt.show()
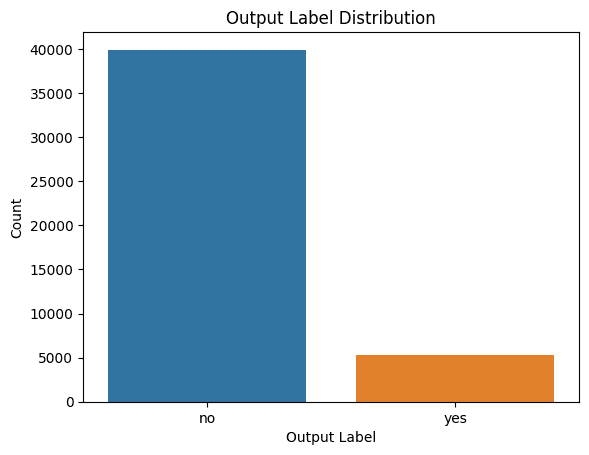
Distribution of Class Labels
We see that there is class imbalance. So if you are building a model, you should be sure to address class imbalance using appropriate resampling methods.
Generic Data Cleaning and Preprocessing Pipeline
Though data cleaning and preprocessing require efforts from the developer, let’s try to get a generic sequence of steps that works reasonably well for a simple dataset.
Prompt: Can you give me a generic data cleaning and preprocessing pipeline based on what we’ve done so far. Get basic info on the dataset, check for and handle missing values, identify categorical columns, and encode categorical columns. Use only pandas.
And here it is:
import pandas as pd

# Load the dataset into a DataFrame
data = pd.read_csv('data.csv')

# Step 1: Basic Info
print(data.info())

# Step 2: Missing Values
missing_values = data.isnull().sum()
print(missing_values)

# Step 3: Handle Missing Values
# Identify columns with missing values
columns_with_missing_values = missing_values[missing_values > 0].index

# Impute missing values using fillna() or other suitable method
data[columns_with_missing_values] = data[columns_with_missing_values].fillna(data[columns_with_missing_values].mean())

# Step 4: Get Categorical Columns
categorical_columns = data.select_dtypes(include=['object']).columns

# Step 5: Encode Categorical Columns
# Perform ordinal encoding or one-hot encoding using pandas' get_dummies() function
encoded_data = pd.get_dummies(data, columns=categorical_columns)

# Print the encoded data
print(encoded_data.head())
Wrapping Up
As seen, data science expertise in synergy with ChatGPT can help make data cleaning and preprocessing simpler and faster. Now that you have the preprocessed dataset ready, you can take this further by building a simple predictive model on this bank marketing dataset.
If interested, you can also explore how to leverage ChatGPT for data exploration.
Dataset Credits
The bank marketing dataset is licensed under a Creative Commons Attribution 4.0 International (CC BY 4.0) license.
Moro,S., Rita,P., and Cortez,P.. (2012). Bank Marketing. UCI Machine Learning Repository. https://doi.org/10.24432/C5K306.
Bala Priya C is a developer and technical writer from India. She likes working at the intersection of math, programming, data science, and content creation. Her areas of interest and expertise include DevOps, data science, and natural language processing. She enjoys reading, writing, coding, and coffee! Currently, she's working on learning and sharing her knowledge with the developer community by authoring tutorials, how-to guides, opinion pieces, and more.