Tips for Data Scientists: Think Like a Business Executive
Thinking like a Data Scientist is important; it puts businesses and business leaders in an analytical frame of mind. But it is also important for Data Scientists to be able to think like business executives. Read on to find out why.
I spend a lot of time helping organizations to “think like a data scientist.” My book “Big Data MBA: Driving Business Strategies with Data Science” has several chapters devoted to helping business leaders to embrace the power of data scientist thinking. My Big Data MBA class at the University of San Francisco School of Management focuses on teaching tomorrow’s business executives the power of analytics and data science to optimize key business processes, uncover new monetization opportunities and create a more compelling, engaging customer and channel engagement.
However in working with our data science teams, I have come to realize that we also need to address the other side of the data science equation; that we need to teach the data scientists in order for them to think like business executives. If the data science team cannot present the analytic results in a way that is relevant and meaningful to the business (so that it is clear what actions the business leaders need to take), then why bother.
In order to engagement more effectively with the business users, here are a couple of key points that the data science team needs to understand as they conduct their analytics:
#1: Tie the analytic results back to the organization’s key business initiatives, and more specifically, the organization’s key business decisions that drive them.
The data science team needs to understand thoroughly the key decisions that the business users are trying to make. Then, the data science team can present where and how the analytic results can help the business users make better decisions.
As part of ensuring that the analytic results are relevant and meaningful to the business, it is also critical to tie the analytic results back to the organization’s key financial or business drivers. Figure 1 shows an example of linking the analytics to the organization’s key financial and business drivers around the following business decision:
Which customers should receive which promotional offers?
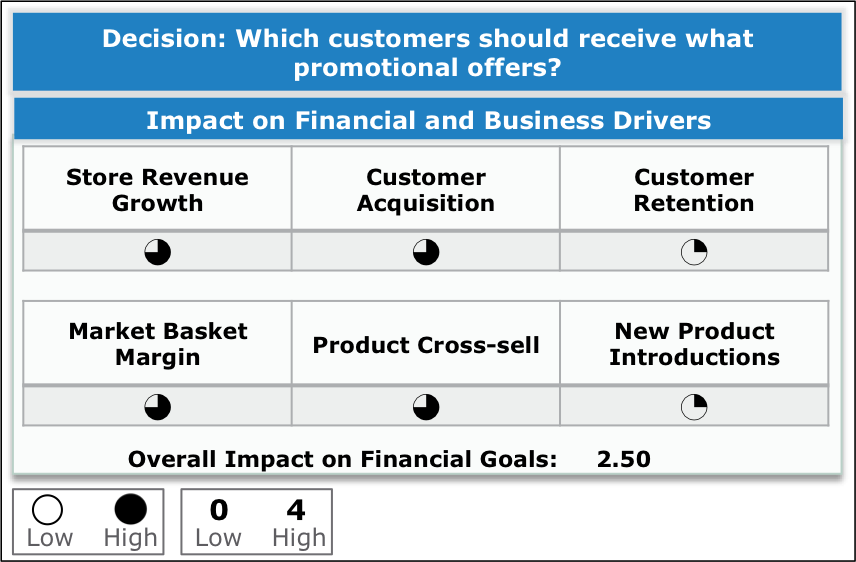
The Harvey Balls in Figure 1 show the relative impact that the promotional offer analytics would have on 6 key financial and business drivers in support of the customer targeting business decision.
Tying the analytic results back to organization’s financial or business drivers is key to ensuring that the data science work is relevant and meaningful to the business.
#2: Presentation of the analytics results is critical.
Don’t make the business users wade through the analytic output to try to figure out what’s important. Instead, make sure that the most meaningful analytic results stand out loud and clear to the business users. If the data supports it, make it stupidly clear where they should focus their attention and efforts.
For example, Figure 2 shows some sample analytic output that the data science team created around the business initiative of improving ground transportation effectiveness at a large location (e.g., shopping mall, port, arena) during a large event.

The business users had to look very hard at this slide to see what the slide was telling them about the business, and specifically what to do. That’s not what the business users want, and that is not how we ensure that our data science work is meaningful and actionable.
Instead, let’s apply some basic concepts to surface the meaningful and actionable insights. In Figure 3, we’ve developed some simple extensions to ensure that the meaningful and actionable insights come to the surface.
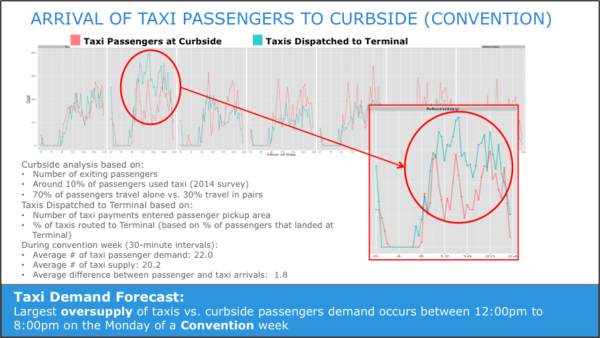
Instead of expecting the business users to wade through the analytics to determine what to do, Figure 3 highlights the key analytic insights or business “takeaways” (sometimes called “aha’s”) in the blue ribbon. Then the rest of the slide can illustrate how the analytics support the conclusions and insights. In particular, we have:
- Highlighted the key actionable takeaways in the blue ribbon at the bottom of the analysis
- We’ve removed extraneous bullet points, words and graphics that are not relevant to the key analytic takeaways.
- We have highlighted the specific areas of the analysis that most loudly support our key takeaways.
Sometimes less really is more!
And if you really want to drive home your analytic points, get a marketing expert (thanks Phil Dussault) to present the analytic insights into a way that is engaging and exciting, while still being informative (see Figure 4).

Now that’s way cool!
Summary: “Thinking Like a Business Executive”
Data scientists can increase their value to the organization when they start to think like a business executive; to focus on how their business audience is going to consume the results of the analytics. The effectiveness of your data science work can be dramatically increased by:
- Tying the analytic results back to the organization’s key decisions and the organization’s key financial and business drivers.
- Effectively and clearly presenting the analytic results, insights and recommendations in a way that is engaging, informative and actionable to the business users.
When the data scientist has accomplished those objectives, then they’re well on their way to making themselves indispensable to the business and crossing the chasm to “thinking like a business executive.”
Original. Reposted with permission.
Related:
- The “Thinking” Part of “Thinking Like A Data Scientist”
- Internet of Things: “Connected” Does Not Equal “Smart”
- Data Lake Plumbers: Operationalizing the Data Lake