Basic Image Processing in Python, Part 2
We explain how to easily access and manipulate the internal components of digital images using Python and give examples from satellite image processing.
This blog is a continuation of Basic Image Data Analysis Using Numpy and OpenCV – Part 1.
Use logical Operator to Process Pixel Values
We can create a bullion ndarray in the same size by using a logical operator. However, this won’t create any new array but it simply returns True to its host variable. For example: let’s consider we want to filter out some low value pixel or high value or (any condition) in an RGB image and yes it would be great to convert RGB to gray scale but for now we won’t go for that rather than deal with color image.
Let’s first load an image and show it on screen.
pic=imageio.imread('F:/demo_1.jpg')

plt.figure(figsize=(10,10))

plt.imshow(pic)

plt.show()

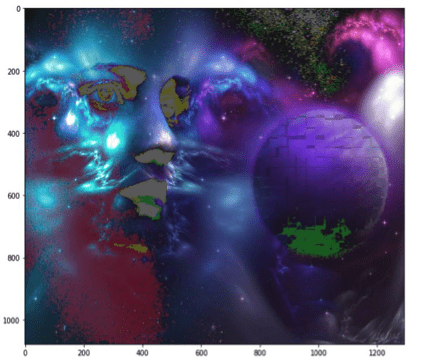
OK, let’s consider this dump image. Now, for any case we want to filter out all the pixel value which is below than, let’s assume 20. For this we’ll use logical operator to do this task which we’ll return as a value of True for all the index.
low_pixel=pic<20

# to ensure of it let's check if all values
in low_pixel are True or not

iflow_pixel.any()==True:
print(low_pixel.shape)

(1079, 1293, 3)
Now as we said, a host variable, well this name is not traditionally used but i refer it because it behaves. It just holds the True value and nothing else. So, if we see the shape of both low_pixel and pic , we’ll find that both have the same shape.
print(pic.shape)
(1079,1293,3)

print(low_pixel.shape)
(1079,1293,3)
We generated that low value filter using a global comparison operator for all the values less than 200. However, we can use this low_pixel array as an index to set those low values to some specific values which may be higher than or lower than the previous pixel value.
# randomly choose a value

importrandom

# load the original image

pic=imageio.imread('F:/demo_1.jpg')

# set value randomly range from 25 to 225 -
these value also randomly chosenpic[low_pixel]=random.randint(25,225)

# display the image

plt.figure(figsize=(10,10))

plt.imshow(pic)plt.show()

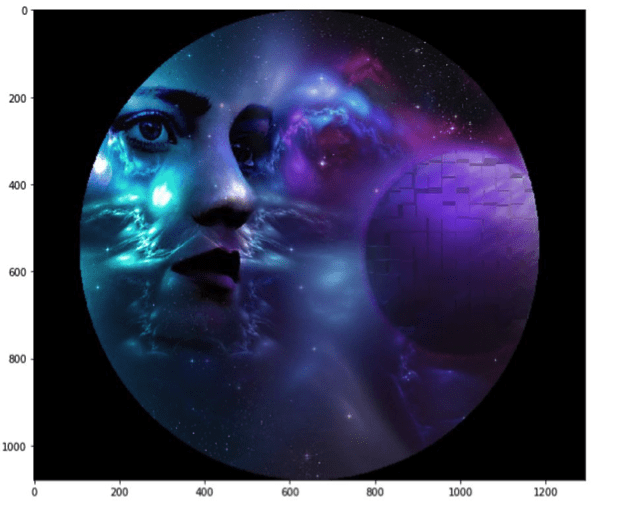
Masking
Image masking is an image processing technique that is used to remove the background from which photographs those have fuzzy edges, transparent or hair portions.
Now, we’ll create a mask that is in shape of a circular disc. First we’ll measure distance from center of the image to every border pixel values. And we take a convenient radius value and then using logical operator we’ll create a circular disc. It’s quite simple, let’s see the code.
if__name__=='__main__':
# load the image
pic=imageio.imread('F:/demo_1.jpg')
# separate the row and column values
total_row,total_col,layers=pic.shape
'''   Create vector.
Ogrid is a compact method of creating a multidimensional-
ndarray operations in single lines.
for ex:
>>>ogrid[0:5,0:5]
output:
[array([[0],[1],[2],[3],[4]]),
array([[0, 1, 2, 3, 4]])]
'''
x,y=np.ogrid[:total_row,:total_col]
# get the center values of the image
cen_x,cen_y=total_row/2,total_col/2
'''
Measure distance value from center to each border pixel.
To make it easy, we can think it's like, we draw a line from center-
to each edge pixel value --> s**2 = (Y-y)**2 + (X-x)**2    '''
distance_from_the_center=np.sqrt((x-cen_x)**2+(y-cen_y)**2)
# Select convenient radius value
radius=(total_row/2)
# Using logical operator '>'
'''   logical operator to do this task which will
return as a value    of True for all the index according to the
given condition   '''
circular_pic=distance_from_the_center>radius
'''
let assign value zero for all pixel value that outside
the circular disc.   All the pixel value outside the circular
disc, will be black now.
'''
pic[circular_pic]=0
plt.figure(figsize=(10,10))
plt.imshow(pic)
plt.show()

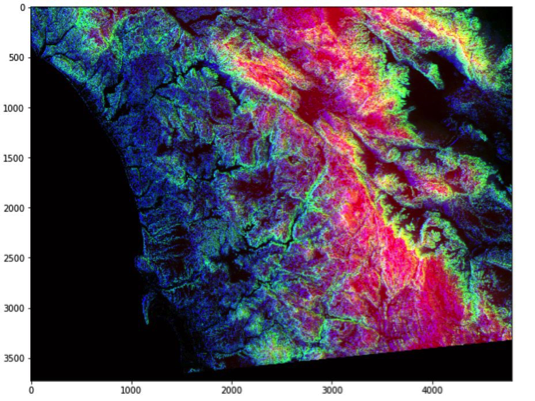
Satellite Image Processing
One of MOOC course on edX, we’ve introduced with some satellite images and its processing system. It’s very informative of course. However, let’s do a few analysis task on it.
# load the image
pic=imageio.imread('F:\satimg.jpg')
plt.figure(figsize=(10,10))
plt.imshow(pic)
plt.show()

Let’s see some basic info of it.
print(f'Shape of the image {pic.shape}')

print(f'hieght {pic.shape[0]} pixels')

print(f'width {pic.shape[1]} pixels')

Shapeoftheimage(3725,4797,3)

height 3725 pixels

width 4797 pixels
Now, There’s something interesting about this image. Like many other visualizations, the colors in each rgb layer mean something. For example, the intensity of the red will be an indication of altitude of the geographical data point in the pixel. The intensity of blue will indicate a measure of aspect and the green will indicate slope. These colors will help to communicate this information in a quicker and more effective way rather than showing numbers.
- Red pixel indicates: Altitude
- Blue pixel indicates: Aspect
- Green pixel indicates: Slope
There is, by just looking at this colorful image, a trained eye can tell already what the altitude, what’s the slope, what’s the aspect. So that’s the idea of loading some more meaning to these colors to indicate something more scientific.
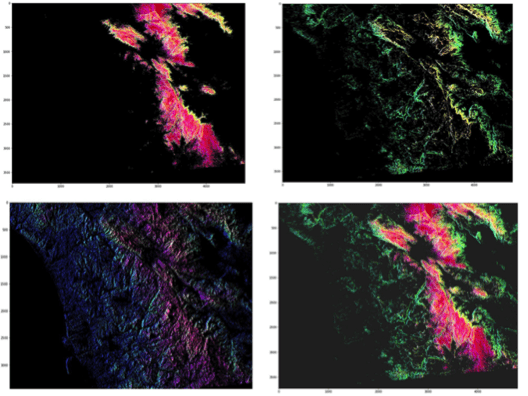
Detecting High Pixel of Each Channel
# Only Red Pixel value , higher than 180

pic=imageio.imread('F:\satimg.jpg')

red_mask=pic[:,:,0]<180

pic[red_mask]=0

plt.figure(figsize=(15,15))

plt.imshow(pic)

# Only Green Pixel value , higher than 180

pic=imageio.imread('F:\satimg.jpg')

green_mask=pic[:,:,1]<180

pic[green_mask]=0

plt.figure(figsize=(15,15))

plt.imshow(pic)

# Only Blue Pixel value , higher than 180

pic=imageio.imread('F:\satimg.jpg')

blue_mask=pic[:,:,2]<180

pic[blue_mask]=0

plt.figure(figsize=(15,15))

plt.imshow(pic)

# Composite mask using logical_and

pic=imageio.imread('F:\satimg.jpg')

final_mask=np.logical_and(red_mask,green_mask,blue_mask)

pic[final_mask]=40

plt.figure(figsize=(15,15))

plt.imshow(pic)
Bio: Mohammed Innat is currently a fourth year undergraduate student majoring in electronics and communication. He is passionate about applying his knowledge of machine learning and data science to areas in healthcare and crime forecast where better solutions can be engineered in medical sector and security department.
Related: