Classifying Heart Disease Using K-Nearest Neighbors
I have written this post for the developers and assumes no background in statistics or mathematics. The focus is mainly on how the k-NN algorithm works and how to use it for predictive modeling problems.
Classification of objects is an important area of research and application in a variety of fields. In the presence of full knowledge of the underlying probabilities, Bayes decision theory gives optimal error rates. In those cases where this information is not present, many algorithms make use of distance or similarity among samples as a means of classification.
The article has been divided into 2 parts. In the first part, we’ll talk all about the K-NN machine learning algorithm and in the second part, we will implement K-NN in real life and classify Heart disease patients.
Table of content
- What is a K-NN algorithm?
- How does the K-NN algorithm work?
- When to choose K-NN?
- How to choose the optimal value of K?
- What is Curse of dimensionality?
- Building K-NN classifier using python sci-kit learn.
- How to improve the performance of your classifier?
What is a K-NN Algorithm?
K-NN Algorithm representation
K-NN or K-Nearest Neighbors is one of the most famous classification algorithms as of now in the industry simply because of its simplicity and accuracy.
K-NN is a simple algorithm that stores all available cases and classifies new cases based on a similarity measure (e.g., distance functions). KNN has been used in statistical estimation and pattern recognition already at the beginning of the 1970s as a non-parametric technique.
The algorithm assumes that similar things exist in close proximity. In other words, entities which are similar exist together.
How the K-NN algorithm works?
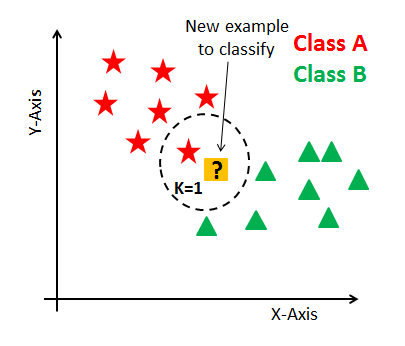
In K-NN, K is the number of nearest neighbors. The number of neighbors is the core deciding factor. K is generally an odd number if the number of classes is 2. When K=1, then the algorithm is known as the nearest neighbor algorithm. This is the simplest case.
In the below figure, suppose yellow colored “?” let's say P is the point, for which label needs to predict. First, you find the one closest point to P and then the label of the nearest point assigned to P.
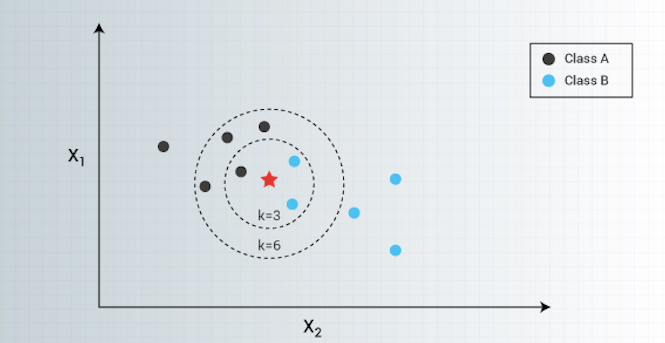
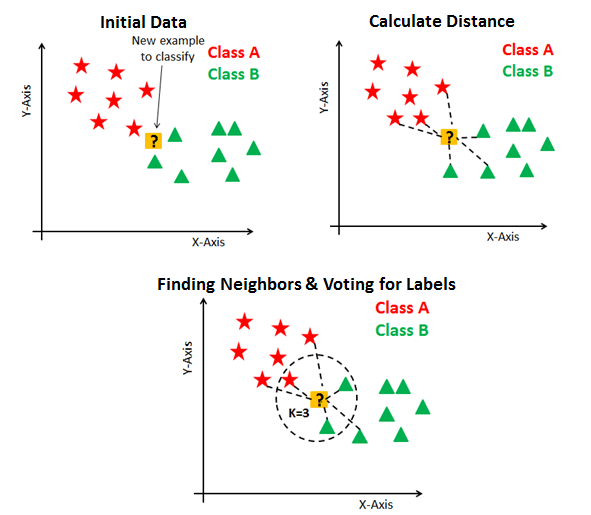
Second, you find the k closest point to P and then classify points by majority vote of its K neighbors. Each object votes for their class and the class with the most votes is taken as the prediction. For finding closest similar points, we find the distance between points using distance measures such as Euclidean distance, Hamming distance, Manhattan distance, and Minkowski distance. The algorithm has the following basic steps:
- Calculate distance
- Find closest neighbors
- Vote for labels
Three most commonly used distance measures used to calculate the distance between point P and its nearest neighbors are represented as :
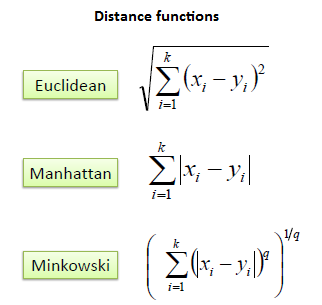
In this article we will go ahead with Euclidean distance, so let's understand it first.
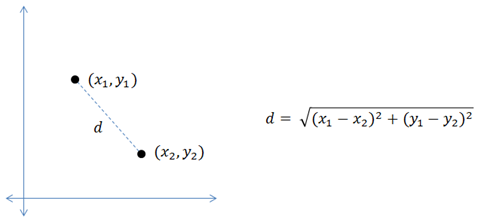
Euclidean distance: It is the most commonly used distance measure also called simply distance. The usage of a Euclidean distance measure is highly recommended when the data is dense or continuous. Euclidean distance is the best proximity measure. The Euclidean distance between two points is the length of the path connecting them. The Pythagorean theorem gives this distance between two points.
Below figure shows how to calculate Euclidean distance between two points in a 2-dimensional plane.
When to use K-NN algorithm?
KNN can be used for both classification and regression predictive problems. However, it is more widely used in classification problems in the industry. To evaluate any technique we generally look at 3 important aspects:
- Ease to interpret the output
- Calculation time of the algorithm
- Predictive Power
Let us compare KNN with different models:
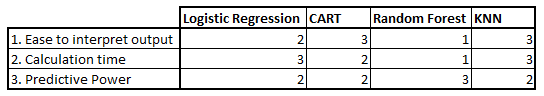
As you can see K-NN surpasses Logistic Regression, CART and Random Forest in terms of the aspects which we are considering.
How to choose the optimal value of K?
The number of neighbors(K) in K-NN is a hyperparameter that you need to choose at the time of building your model. You can think of K as a controlling variable for the prediction model.
Now, choosing the optimal value for K is best done by first inspecting the data. In general, a large K value is more precise as it reduces the overall noise but there is no guarantee. Cross-validation is another way to retrospectively determine a good K value by using an independent dataset to validate the K value. Historically, the optimal K for most datasets has been between 3–10. That produces much better results than 1NN(when K=1).
Generally, an odd number is chosen if the number of classes is even. You can also check by generating the model on different values of K and check their performance.
Curse of Dimensionality
K-NN performs better with a lower number of features than a large number of features. You can say that when the number of features increases than it requires more data. Increase in dimension also leads to the problem of overfitting. To avoid overfitting, the needed data will need to grow exponentially as you increase the number of dimensions. This problem of higher dimension is known as the Curse of Dimensionality.
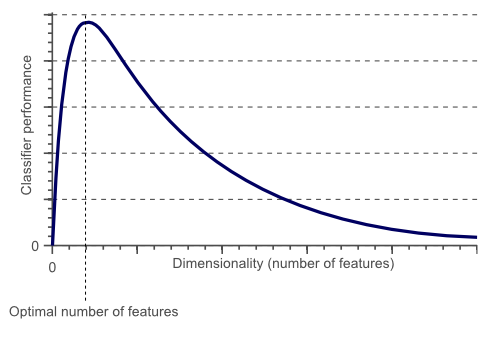
From the above graphical representation, it is clearly visible that the performance of your model decreases with an increase in the number of features(dimensions).
To deal with the problem of the curse of dimensionality, you need to perform principal component analysis(PCA) before applying any machine learning algorithm, or you can also use feature selection approach. Research has shown that in large dimension Euclidean distance is not useful anymore. Therefore, you can prefer other measures such as cosine similarity, which get decidedly less affected by high dimension.
The KNN algorithm can compete with the most accurate models because it makes highly accurate predictions. Therefore, you can use the KNN algorithm for applications that require high accuracy but that do not require a human-readable model. — source: IBM
Steps to compute K-NN algorithm:
- Determine parameter K = number of nearest neighbors.
- Calculate the distance between the query-instance and all the training samples.
- Sort the distance and determine nearest neighbors based on the K-th minimum distance.
- Gather the category of the nearest neighbors
- Use a simple majority of the category of nearest neighbors as the prediction value of the query.
In the next section, we are going to solve a real world scenario using K-NN algorithm.