 A Complete Guide To Survival Analysis In Python, part 1
This three-part series covers a review with step-by-step explanations and code for how to perform statistical survival analysis used to investigate the time some event takes to occur, such as patient survival during the COVID-19 pandemic, the time to failure of engineering products, or even the time to closing a sale after an initial customer contact.
By Pratik Shukla, Aspiring machine learning engineer.

Survival Analysis Basics
Survival analysis is a set of statistical approaches used to find out the time it takes for an event of interest to occur. Survival analysis is used to study the time until some event of interest (often referred to as death) occurs. Time could be measured in years, months, weeks, days, etc. The event of interest could be anything of interest. It could be an actual death, a birth, a retirement, etc.
How it can be useful to analyze ongoing COVID-19 pandemic data?
(1) We can find the number of days until patients showed COVID-19 symptoms.
(2) We can find for which age group it’s deadlier.
(3) We can find which treatment has the highest survival probability.
(4) We can find whether a person’s sex has a significant effect on their survival time?
(5) We can also find the median number of days of survival for patients.
We are going to perform a thorough analysis of patients with lung cancer. Don’t worry once you understand the logic behind it, you’ll be able to perform it on any data set. Exciting, isn’t it?
Survival analysis is used in a variety of field such as:
- Cancer studies for patients survival time analyses.
- Sociology for “event-history analysis”.
- In Engineering for “failure-time analysis”.
- Time until product failure.
- Time until a warranty claim.
- Time until a process reaches a critical level.
- Time from initial sales contact to a sale.
- Time from employee hire to either termination or quit.
- Time from a salesperson hire to their first sale.
In cancer studies, typical research questions include:
(1) What is the impact of certain clinical characteristics on patient’s survival? For example, is there any difference between the group of people who has higher blood sugar and those who don’t?
(2) What is the probability that an individual survives a specific period (years, months, days)? For example, given a set of cancer patients, we will be able to tell that if 300(random number) days after the diagnosis of cancer has been passed, then the probability of that person being alive at that time will be 0.7 (random number).
(3) Are there differences in survival between groups of patients? For example, let’s say there are 2 groups of people diagnosed with cancer. Those 2 groups were given 2 different kinds of treatments. Now our goal here will be to find out if there is a significant difference between the survival time for those 2 different groups based on the treatment they were given.
Objectives
In cancer studies, most of the survival analyses use the following methods.
(1) Kaplan-Meier plots to visualize survival curves.
(2) Nelson-Aalen plots to visualize the cumulative hazard.
(3) Log-rank test to compare the survival curves of two or more groups
(4) Cox proportional hazards regression to find out the effect of different variables like age, sex, weight on survival.
Fundamental concepts
Here, we start by defining fundamental terms of survival analysis, including:
- Survival time and event.
- Censoring of data.
- Survival function and hazard function.
Survival time and type of events in cancer studies
Survival Time: referred to an amount of time until when a subject is alive or actively participates in a survey.
There are mainly three types of events, including:
(1) Relapse: a deterioration in someone’s state of health after a temporary improvement.
(2) Progression: the process of developing or moving gradually towards a more advanced state. ( Improvement in health.)
(3) Death: the destruction or permanent end of something.
Censoring
As mentioned above, survival analysis focuses on the occurrence of an event of interest (e.g., birth, death, retirement). But there is still a possibility that the event may not be observed for various reasons. Such observations are known as censored observations.
Censoring may arise in the following ways:
- A patient has not (yet) experienced the event of interest (death or relapse in our case) within the study period.
- A patient is not followed anymore.
- If a patient moves to another city, then follow-up might not be possible for the hospital staff.
This type of censoring, named right censoring, is handled in survival analysis.
There are three general types of censoring, right-censoring, left-censoring, and interval-censoring.
Right Censoring: The death of the person.
Left Censoring: The event can’t be observed for some reason. It includes events that occurred before the experiment started. (e.g., number of days from birth when the kid started walking.)
Interval Censoring: When we have data for some intervals only.
Survival and hazard functions
We generally use two related probabilities to analyse survival data.
(1) The survival probability
(2) The hazard probability
To find survival probability, we’ll be using survivor function S(t), which is the Kaplan-Meier Estimator. Survival probability is the probability that an individual (e.g., patient) survives from the time origin (e.g., diagnosis of cancer) to a specified future time t. For example, S(200) = 0.7 means that after 200 days has passed since the diagnosis of cancer, the patient’s survival probability has dropped to 0.7. If the person stays alive at the end of an experiment, then that data will be censored.
The hazard probability, denoted by h(t), is the probability that an individual(e.g., patient) who is under observation at a time t has an event(e.g., death) at that time. For example, If h(200) = 0.7, then it means that the probability of that person being dead at time t=200 days is 0.7.
Note that, in contrast to the survivor function, which focuses on not having an event, the hazard function focuses on the event occurring. I think we can clearly see that higher survival probability and lower hazard probability is good for the patient.
Let’s move forward to the cool coding part!
You can download the dataset from here.
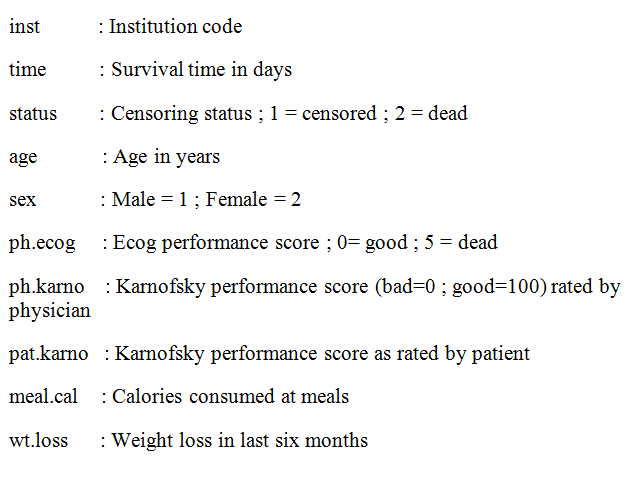
Data Description

Kaplan-Meier Estimator
The Kaplan–Meier estimator is a non-parametric statistic used to estimate the survival function (probability of a person surviving) from lifetime data. In medical research, it is often used to measure the fraction of patients living for a certain amount of time after treatment. For example, Calculating the amount of time(year, month, day) certain patient lived after he/she was diagnosed with cancer or his treatment starts. The estimator is named after Edward L. Kaplan and Paul Meier, whom each submitted similar manuscripts to the Journal of the American Statistical Association.
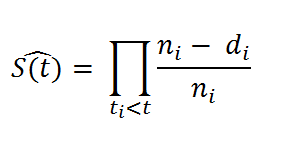
The formula for Kaplan-Meier is as follows:
The probability at time ti, S(ti), is calculated as

We can also write it as

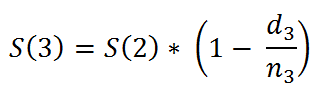
Survival Function
For example,


In a more generalized way, we can say that,

Survival function simplified.
For example, we can say that,

In the next article, we’ll implement Kaplan-Meier fitter and Nelson-Aalen fitter using python.
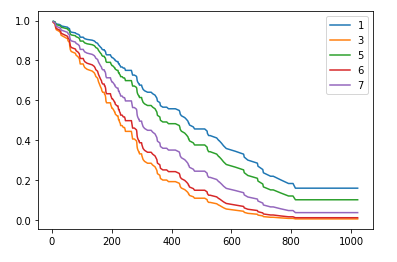
Final Result
At the end of this three-part series, you’ll be able to plot graphs like this from which we can extrapolate on the survival of a patient. Hang tight!

The whole series:
- A Complete Guide To Survival Analysis In Python, part 1
This three-part series covers a review with step-by-step explanations and code for how to perform statistical survival analysis used to investigate the time some event takes to occur, such as patient survival during the COVID-19 pandemic, the time to failure of engineering products, or even the time to closing a sale after an initial customer contact.
- A Complete Guide To Survival Analysis In Python, part 2
We look at a detailed example implementing the Kaplan-Meier fitter theory as well as the Nelson-Aalen fitter theory, both with examples and shared code.
- A Complete Guide To Survival Analysis In Python, part 3
We look at a detailed example implementing the Kaplan-Meier fitter based on different groups, a Log-Rank test, and Cox Regression, all with examples and shared code.
Original. Reposted with permission.
Bio: Pratik Shukla is an aspiring machine learning engineer who loves to put complex theories in simple ways. Pratik pursued his undergraduate in computer science and is going for a master's program in computer science at University of Southern California. “Shoot for the moon. Even if you miss it you will land among the stars. -- Les Brown”
Related:

 A Complete Guide To Survival Analysis In Python, part 1