 A Machine Learning Model Monitoring Checklist: 7 Things to Track
 A Machine Learning Model Monitoring Checklist: 7 Things to Track
Once you deploy a machine learning model in production, you need to make sure it performs. In the article, we suggest how to monitor your models and open-source tools to use.
By Emeli Dral, CTO and Co-founder of Evidently AI & Elena Samuylova, CEO and Co-founder at Evidently AI
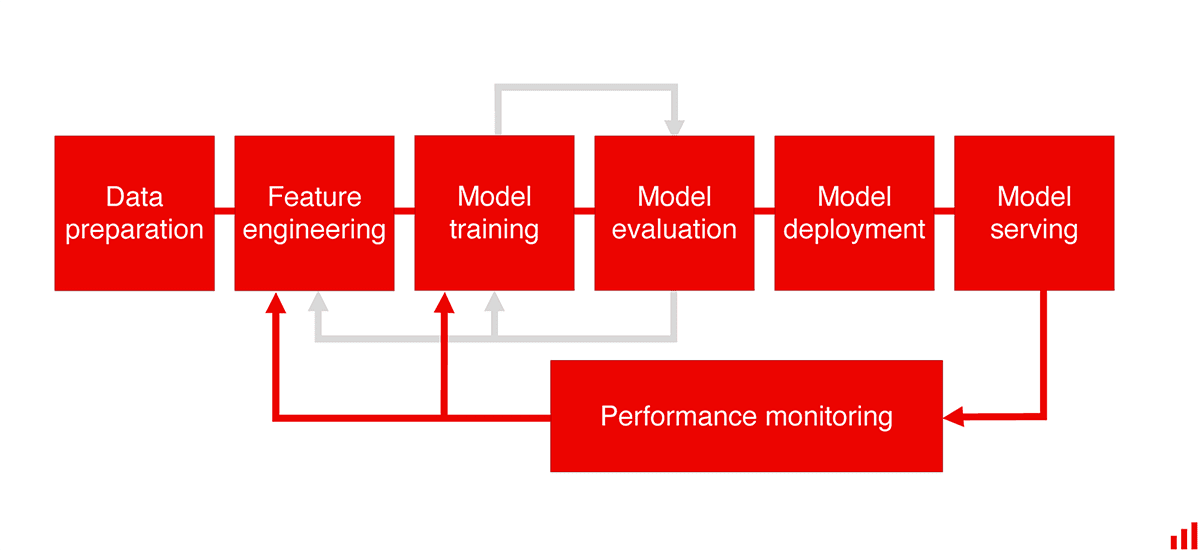
It is not easy to build a machine learning model. It is even harder to deploy a service in production. But even if you managed to stick all the pipelines together, things do not stop here.
Once the model is in use, we immediately have to think about operating it smoothly. It is now delivering the business value, after all! Any disruption to model performance directly translates to the actual business loss.
We need to make sure the model delivers. Not just as a piece of software that returns the API response but as a machine learning system that we can trust to make the decisions.
It means we need to monitor our models. And there are more things to look for!
If ML in production caught you off-guard, here is a checklist of what to keep an eye on.
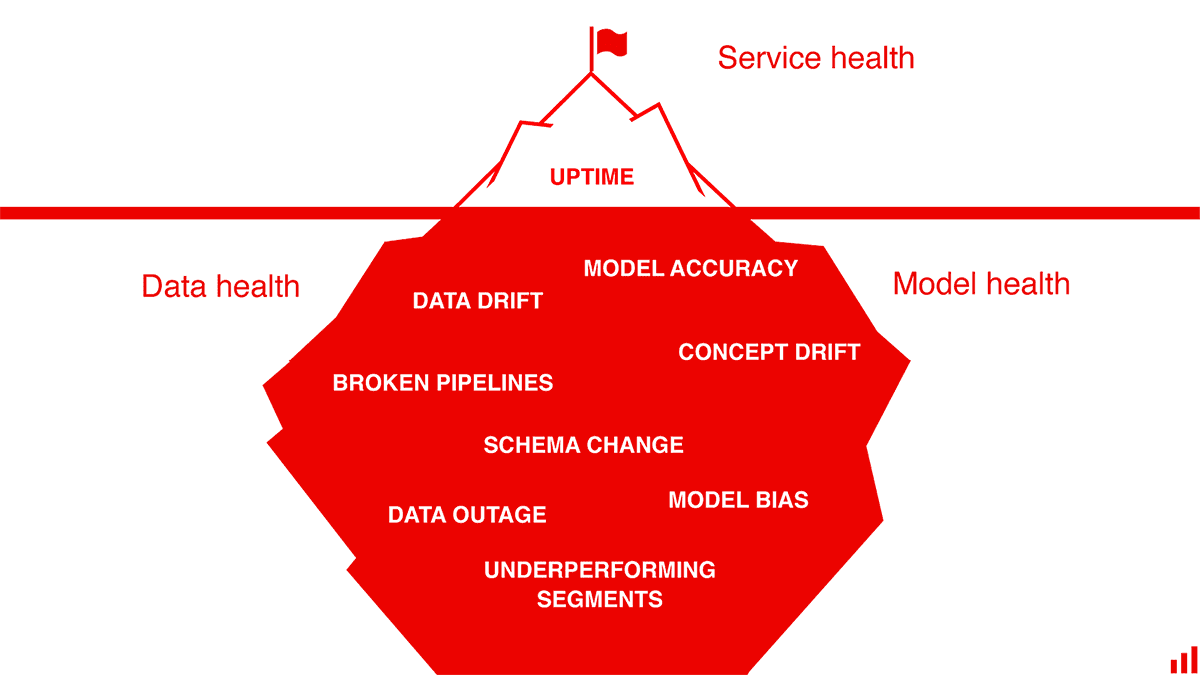
1. Service Health
Machine learning service is still a service. Your company probably has some established process of software monitoring that you can reuse. If the model runs in real-time, it needs proper alerting and responsible people on-call.
Even if you deal with batch models only, do not make an exception! We still need to track standard health indicators like memory utilization, CPU load, and so on.
Our goal is to ensure that the service is operational and we comply with necessary constraints, such as the speed of response.
An open-source tool to check: Grafana.
2. Data Quality & Integrity
Is something wrong with a machine learning model? In a vast majority of cases, the data is to blame.
Upstream pipelines and models break. Users make an unannounced schema change. The data can disappear at the source, the physical sensors fail. The list goes on.
Thus it is crucial to validate that the input data lives up to our expectations. The checks might include range compliance, data distribution, feature statistics, correlations, or any behavior we consider to be “normal” for our dataset.
Our goal is to confirm that we are feeding the data the model can handle. Before it returns an unreliable response.
An open-source tool to check: Great Expectations.
3. Data & Target Drift
Things change. Even when we deal with very stable processes. Almost every machine learning model has this inconvenient trait: it will degrade with time.
We might experience Data Drift when the model receives data that it has not seen in training. Imagine users coming from a different age group, marketing channel, or geographic area.
If the real-world patterns change, the Concept Drift kicks in. Think of something casual like a global pandemic affecting all customer behavior. Or a new competing product on the market offering a generous free tier. It changes how users respond to your marketing campaigns.
The ultimate measure of both drifts is the degradation of model quality. But sometimes, the actual values are not yet known, and we cannot calculate it directly. In this case, there are leading indicators to track. We can monitor if the properties of the input data or target function have changed.
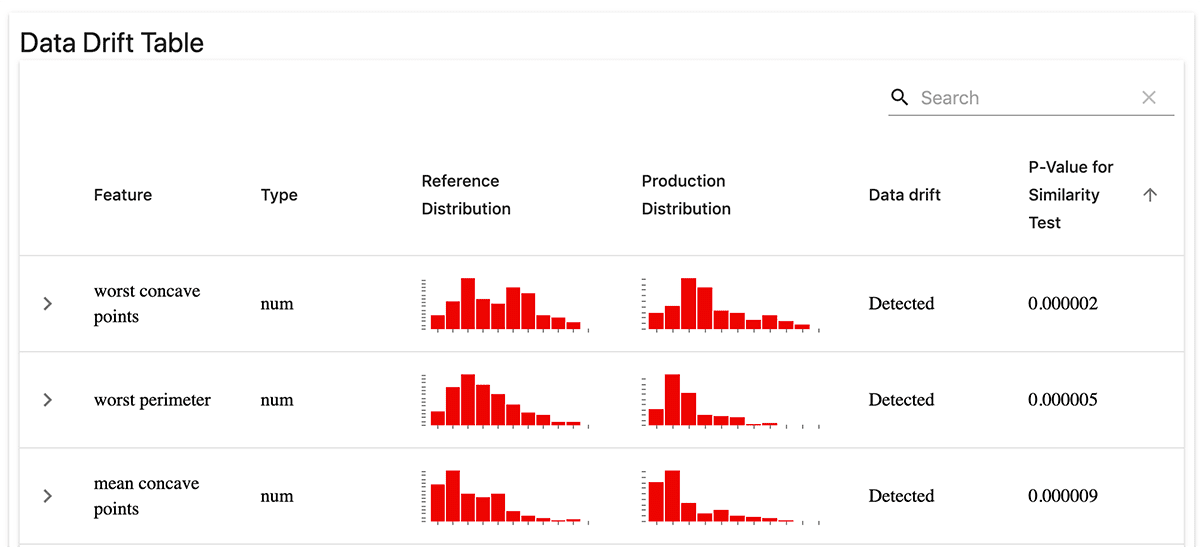
For example, you can track the distributions both for the key model features and the model prediction. Then, trigger an alert if they significantly differ from a past timeframe.
Our goal is to get early signals that the world or the data has changed, and it is time to update our model.
An open-source tool to check: Evidently.
4. Model Performance
The most direct way to know if your model works well is to contrast your predictions against the actual values. You can use the same metrics from the model training phase, be it Precision/Recall for classification, RMSE for regression, and so on. If something happens with the data quality or the real-world patterns, we will see the metrics creep down.
There are a few caveats here.
First, the ground truth or actual labels often come with a delay. For example, if you make your forecasts for a long horizon or there is a lag in data delivery. Sometimes you need an extra effort to label new data to check if your predictions are correct. In this case, it makes sense first to track data and target drift as an early warning.
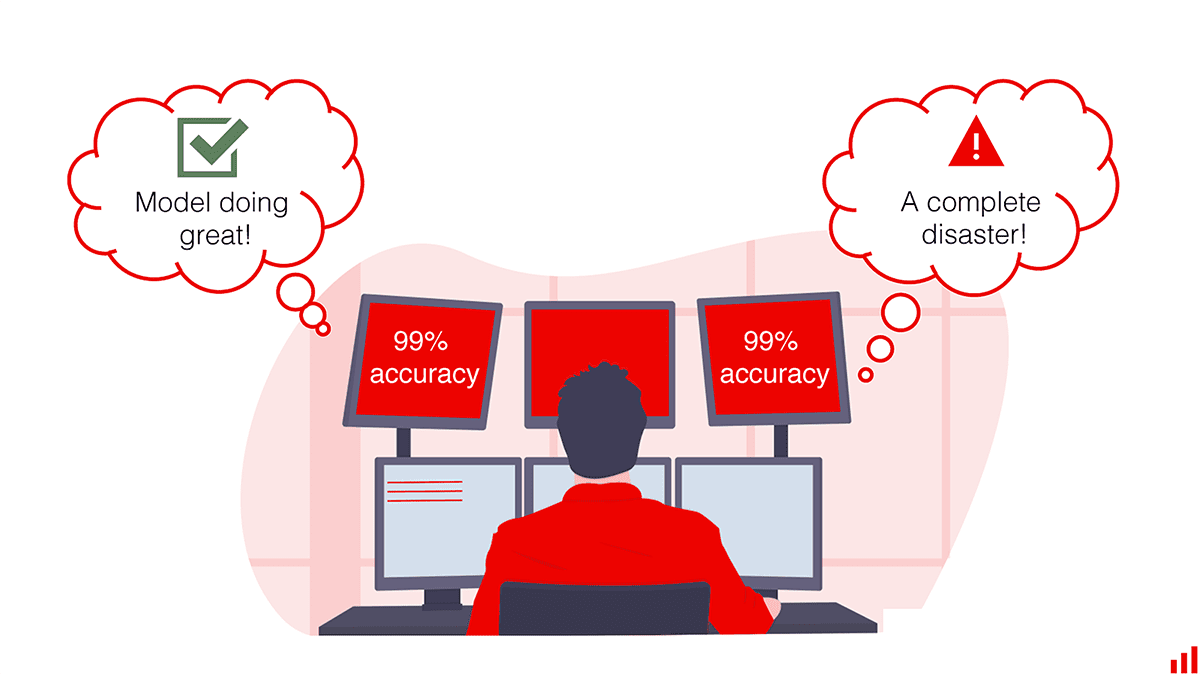
Second, one needs to track not just the model quality but a related business KPI. The decrease in ROC AUC does not directly say how much it impacts, say, marketing conversions. It is vital to connect model quality to the business metric or find some interpretable proxies.
Third, your quality metrics should fit the use case. For example, the accuracy metric is far from ideal if you have unbalanced classes. With regression problems, you might care about the error sign. Thus, you should track not just the absolute values but the error distribution, too. It is also critical to distinguish between occasional outliers and real decay.
So pick your metrics wisely!
Our goal is to track how well the model serves its purpose and how to debug it when things go wrong.
An open-source tool to check: Evidently.
5. Performance by segment
For many models, the monitoring setup described above will be enough. But if you deal with more critical use cases, there are more items to check for.
For example, where does the model make more mistakes, and where does it work best?
You might already know some specific segments to track: like model accuracy for your premium customers versus the overall base. It would require a custom quality metric calculated only for the objects inside the segment you define.
In other cases, it would make sense to search for segments of low performance proactively. Imagine that your real estate pricing model consistently suggests higher-than-actual quotes in a particular geographic area. That is something you want to notice!
Depending on the use case, we can tackle it by adding post-processing or business logic on top of the model output. Or by rebuilding the model to account for the low-performing segment.
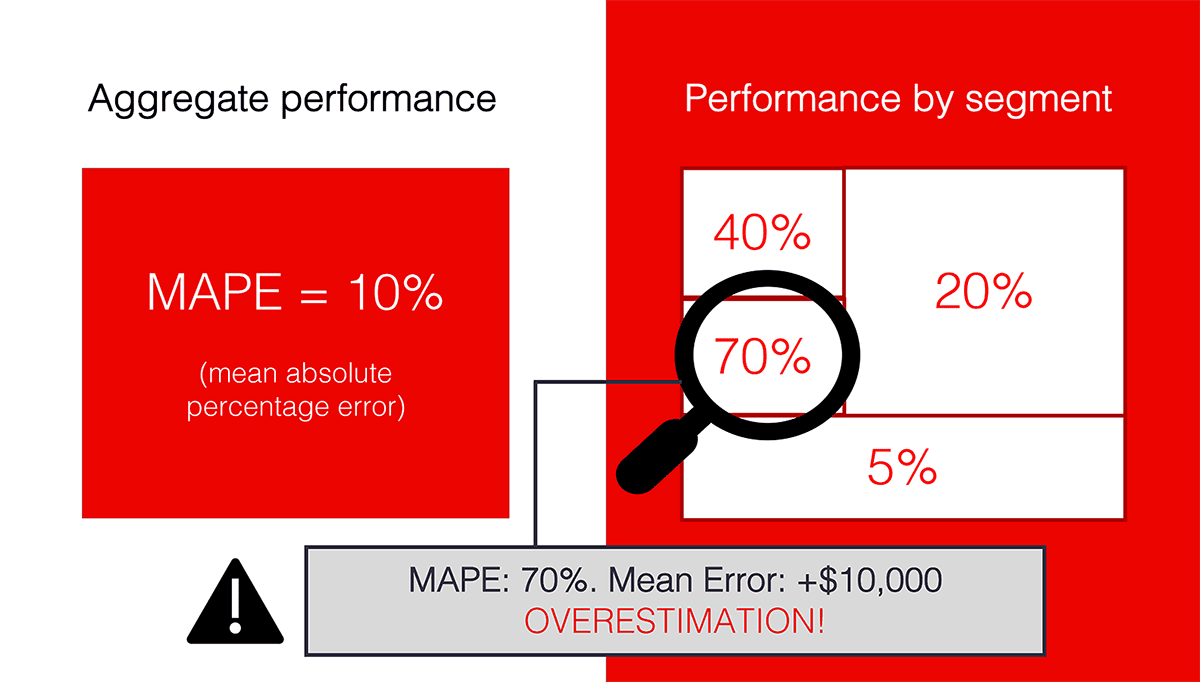
Our goal is to go beyond aggregate performance and understand the model quality on specific slices of data.
6. Bias/fairness
When it comes to finance, healthcare, education, and other areas where model decisions might have serious implications, we need to scrutinize our models even more.
For example, the model performance might vary for different demographic groups based on their representation in the training data. Model creators need to be aware of this impact and have tools to mitigate unfairness together with regulators and stakeholders.
For that, we need to track suitable metrics such as parity in the accuracy rate. It applies both to the model validation and ongoing production monitoring. So, a few more metrics to the dashboard!
Our goal is to ensure fair treatment for all sub-groups and track compliance.
An open-source tool to check: Fairlearn.
7. Outliers
We know that models make errors. In some use cases, like ad targeting, we probably do not care if individual inputs appear weird or usual. As long as they do not constitute a meaningful segment the model fails on!
In other applications, we might want to know about each such case. To minimize the errors, we can design a set of rules to handle outliers. For example, send them for manual review instead of making an automated decision. In this case, we need a way to detect and flag them accordingly.
Our goal is to label anomalous data inputs where model predictions can be untrustworthy.
An open-source tool to check: Seldon Alibi-Detect
Monitoring might sound boring. But, it is essential to make machine learning work in the real world. Don’t wait for the model to fail to create your first dashboard!
Emeli Dral is a Co-founder and CTO at Evidently AI where she creates tools to analyze and monitor ML models. Earlier she co-founded an industrial AI startup and served as the Chief Data Scientist at Yandex Data Factory. She is a co-author of the Machine Learning and Data Analysis curriculum at Coursera with over 100,000 students.
Elena Samuylova is a Co-founder and CEO at Evidently AI. Earlier she co-founded an industrial AI startup and led business development at Yandex Data Factory. Since 2014, she has worked with companies from manufacturing to retail to deliver ML-based solutions. In 2018, Elena was named 50 Women in Product Europe by Product Management Festival.
Related:
- Machine Learning Systems Design: A Free Stanford Course
- MLOps: Model Monitoring 101
- How to Use MLOps for an Effective AI Strategy