 Top 10 Python Libraries Data Scientists should know in 2021

 Top 10 Python Libraries Data Scientists should know in 2021
So many Python libraries exist that offer powerful and efficient foundations for supporting your data science work and machine learning model development. While the list may seem overwhelming, there are certain libraries you should focus your time on, as they are some of the most commonly used today.

Photo by David Clode on Unsplash.
Learning data science can be overwhelming. There are hundreds of tools and resources out there, and it’s not always obvious what tools you should be focusing on or what you should learn.
The short answer is that you should learn what you enjoy because data science offers a wide range of skills and tools. That being said, I wanted to share with you what I believe are the top 10 Python libraries that are most commonly used in data science.
With that said, here are the Top 10 Python Libraries for Data Science.
1. Pandas
You’ve heard the saying. 70 to 80% of a data scientist’s job is understanding and cleaning the data, aka data exploration and data munging.
Pandas is primarily used for data analysis, and it is one of the most commonly used Python libraries. It provides you with some of the most useful set of tools to explore, clean, and analyze your data. With Pandas, you can load, prepare, manipulate, and analyze all kinds of structured data. Machine learning libraries also revolve around Pandas DataFrames as an input.
Where to Learn Pandas
2. NumPy
NumPy is mainly used for its support for N-dimensional arrays. These multi-dimensional arrays are 50 times more robust compared to Python lists, making NumPy a favorite for data scientists.
NumPy is also used by other libraries such as TensorFlow for their internal computation on tensors. NumPy also provides fast precompiled functions for numerical routines, which can be hard to manually solve. To achieve better efficiency, NumPy uses array-oriented computations, so working with multiple classes becomes easy.
Where to Learn NumPy
3. Scikit-learn
Scikit-learn is arguably the most important library in Python for machine learning. After cleaning and manipulating your data with Pandas or NumPy, scikit-learn is used to build machine learning models as it has tons of tools used for predictive modelling and analysis.
There are many reasons to use scikit-learn. To name a few, you can use scikit-learn to build several types of machine learning models, supervised and unsupervised, cross-validate the accuracy of models, and conduct feature importance.
Where to Learn Scikit-learn
4. Gradio
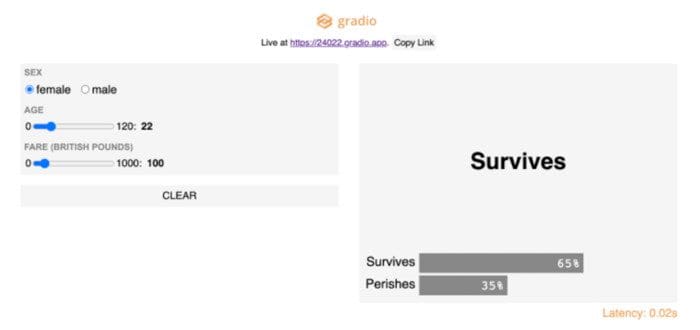
Image taken by Gradio (with permission)
Gradio lets you build and deploy web apps for your machine learning models in as little as three lines of code. It serves the same purpose as Streamlit or Flask, but I found it much faster and easier to get a model deployed.
Gradio is useful for the following reasons:
- It allows for further model validation. Specifically, it allows you to interactively test different inputs into the model.
- It’s a good way to conduct demos.
- It’s easy to implement and distribute because the web app is accessible by anyone through a public link.
Where to Learn Gradio
5. TensorFlow
TensorFlow is one of the most popular libraries of Python for implementing neural networks. It uses multi-dimensional arrays, also known as tensors, which allows it to perform several operations on a particular input.
Because it is highly parallel in nature, it can train multiple neural networks and GPUs for highly efficient and scalable models. This feature of TensorFlow is also called pipelining.
Where to Learn TensorFlow
6. Keras
Keras is mainly used for creating deep learning models, specifically neural networks. It’s built on top of TensorFlow and Theano and allows you to build neural networks very simply. Since Keras generates a computational graph using back-end infrastructure, it is relatively slow compared to other libraries.
Where to Learn Keras
7. SciPy
As the name suggests, SciPy is mainly used for its scientific functions and mathematical functions derived from NumPy. Some useful functions which this library provides are stats functions, optimization functions, and signal processing functions. To solve differential equations and provide optimization, it includes functions for computing integrals numerically. Some of the applications which make SciPy important are:
- Multi-dimensional image processing
- Ability to solve Fourier transforms, and differential equations
- Due to its optimized algorithms, it can do linear algebra computations very robustly and efficiently
Where to Learn SciPy
8. Statsmodels
Statsmodels is a great library for doing hardcore statistics. This multifunctional library is a blend of different Python libraries, taking its graphical features and functions from Matplotlib, for data handling, it uses Pandas, for handling R-like formulas, it uses Pasty, and is built on NumPy and SciPy.
Specifically, it’s useful for creating statistical models, like OLS, and also for performing statistical tests.
Where to Learn Statsmodels
9. Plotly
Plotly is definitely a must-know tool for building visualizations since it is extremely powerful, easy to use, and has a big benefit of being able to interact with the visualizations.
Along with Plotly is Dash, which is a tool that allows you to build dynamic dashboards using Plotly visualizations. Dash is a web-based python interface that removes the need for JavaScript in these types of analytical web applications and allows you to run these plots online and offline.
Where to Learn Plotly
10. Seaborn
Built on the top of Matplotlib, Seaborn is an effective library for creating different visualizations.
One of the most important features of Seaborn is the creation of amplified data visuals. Some of the correlations that are not obvious initially can be displayed in a visual context, allowing Data Scientists to understand the models more properly.
Due to its customizable themes and high-level interfaces, it provides well-designed and extraordinary data visualizations, hence making the plots very attractive, which can, later on, be shown to stakeholders.
Where to Learn Seaborn
Related: