 Vaex: Pandas but 1000x faster

 Vaex: Pandas but 1000x faster
If you are working with big data, especially on your local machine, then learning the basics of Vaex, a Python library that enables the fast processing of large datasets, will provide you with a productive alternative to Pandas.

Photo by Harley-Davidson on Unsplash.
While working with pandas, if you have encountered a large dataset, then you might have thought of an alternative, especially when your machine is not strong. Pandas is really good for small/average-sized datasets, but as data gets bigger, it does not perform as well as it performs on simple and smaller datasets.
Here you can see the comparison of Pandas with another library modin on reading the dataset from a CSV file.
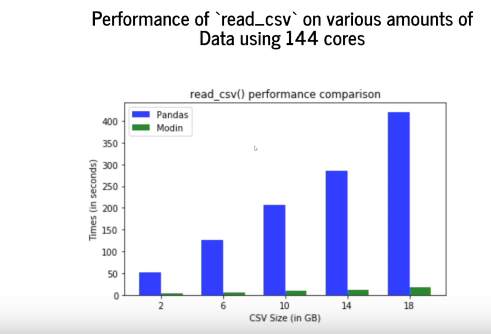
Similarly, a very common problem pandas users often go through is the dead jupyter kernel due to out of memory. The computations are expensive, and the CPU is not strong enough to handle those.
In this article, you are going to learn about Vaex, a Python library that is similar to Pandas, how to install it, and some of its important functions that can help you in performing different tasks.
Introduction to Vaex
Vaex is a python library that is an out-of-core dataframe, which can handle up to 1 billion rows per second. 1 billion rows. Yes, you read it right, that too, in a second. It uses memory mapping, a zero-copy policy which means that it will not touch or make a copy of the dataset unless explicitly asked to. This makes it possible to work with datasets that are equal to the size of your hard drive. Vaex also uses lazy computations for the best performance and no memory wastage.
Installation
You can install vaex using pip:
pip install vaex
Or, if you use anaconda, you can use conda to install.
conda install -c conda-forge vaex
Getting Started
We will import both vaex and pandas to compare the performance.
import vaex
import pandas as pd
We will create an artificial dataset and read it both using Pandas and Vaex to see the difference in the performance.
import numpy as np
n_rows = 1000000
n_cols = 20
df = pd.DataFrame(np.random.randint(100000000, 1000000000, size=(n_rows, n_cols)), columns=[‘c%d’ % i for i in range(n_cols)])
This dataset contains 1000,000 rows and 20 columns.
Let’s save it in a csv file.
df.to_csv(‘dataset.csv’, index=False)
Vaex can work well with both CSV files and hdf5 files. To read a CSV file, we can use vaex.from_csv function. This function can read a CSV file and optionally convert it to HDF5 format.
If you are working with the jupyter notebook, you can use %%time magic command to check the execution time.
%%time
vaex_df = vaex.from_csv(‘dataset.csv’,convert=True, chunk_size=5_000)
You can check the execution time, which is 15.8ms. If the CSV file is large, you can use chunk_size argument to read the file in chunks.

You can see that it is taking about 15.8 ms total to read the file, which is around 200 MBs.
This has created an hdf5 file too. Let us read that using vaex.
%%time

vaex_df = vaex.open(‘dataset.csv.hdf5’)
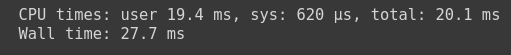
You can see that vaex has read the simple hdf5 file in 20.1 ms total with 19.4 ms CPU time.
Let us read the same file using pandas.
%%time

df_test = pd.read_csv('dataset.csv')
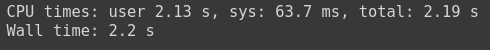
And you can see that it took pandas 2.19 s total to read the same file, which shows a big performance difference between vaex and pandas.
If we add the same chunk size to both vaex and pandas, we can see that vaex is still very fast as compared to pandas.
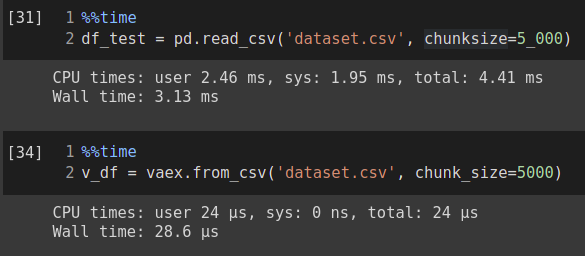
Here vaex read the data in 28.6 µs which is equal to 0.02 ms, whereas pandas read the same file in 4.41 ms total, which is a huge performance gap.
Important Vaex Functions
Functions related to Opening/Reading the dataset
(1) Open
Using the Open function, you can open a dataframe by giving its path. You can convert your dataframe to other formats such as hdf5 format using the Open function. This function can take a path or a list of paths to read the dataset. Some examples of it are given.
>>> df = vaex.open('table1.hdf5')
>>> df = vaex.open('datafile#*.csv', convert='bigdata.hdf5')
(2) Open Many Files
Often you have data distributed in many files, and you have to open them separately. Vaex provides open_many function, which can open the list of filenames, and return a DataFrame with all DataFrames concatenated at a fast speed.
import vaex

df_concat = vaex.open_many(['file1.csv', 'file2.csv'])
(3) Concat
Concat is a function in vaex that can concatenate the given list of data frames. For example:
new_df = vaex.concat([df1, df2, df3])
This will concatenate the list of data frames into a new dataframe.
(4) Creating a Dataframe using Pandas DataFrame
This function is used to create an in-memory dataframe using a pandas dataframe.
import vaex

import pandas as pd

df = pd.read_csv(‘test.csv’) #pandas dataframe

df_vaex = vaex.from_pandas(df) #in-memory vaex df
(5) DataFrame from Array
This function takes in a list or an array and converts it into a vaex dataframe.
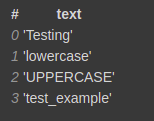
text = [‘Testing’, ‘lowercase’, ‘UPPERCASE’, ‘test_example’]

df = vaex.from_arrays(text=text)
Important Functions related to Statistics and Aggregation
(1) Finding Correlation
Oftentimes, you need to find the correlation, vaex provides an easy way to calculate the correlation.
df.correlation(x, y=None, binby=[], limits=None, shape=128, sort=False, sort_key=<ufunc 'absolute'>, selection=False, delay=False, progress=None)
Here vaex calculates the correlation between x and y, possibly on a grid defined by binby. Here x and y are 2 expressions.
Let's say you have a DataFrame, with 5 columns as follows.
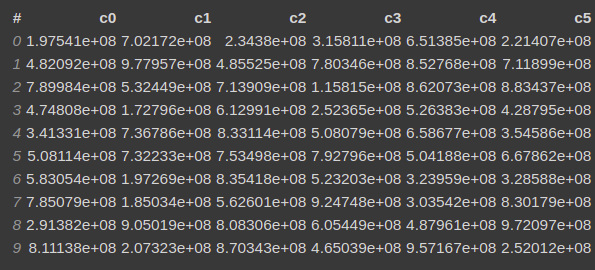
You want to calculate the correlation based on the following expressions.
x = "c0**2+c1**2+c2**2+c3**2"
and
y ="-log(c4+c5)",
then it will calculate the correlation coefficient using the following formula cov[x,y]/(std[x]*std[y]) between x and y.
vaex_df.correlation(x="c0**2+c1**2+c2**2+c3**2", y="-log(c4+c5)")
(2) Count
This function counts the number of Not Null values, or all values if the expression provided is * or None.
vaex_df.count('*') #counts all values
![]()
vaex_df.count() #counts not null values only
![]()
(3) Covariance
Creating a covariance matrix is another important trick to get statistical insights from a dataset. Using vaex, you can quickly create a covariance matrix by using covar function on a DataFrame.
You need to provide two expressions, x and y, that will calculate the covariance cov[x,y] possibly on-grid defined by binby. This function will return a scalar if no binby is provided.
vaex_df.covar("c0**2+c1**2+c2**2", '-log(c4)', binby='c4')
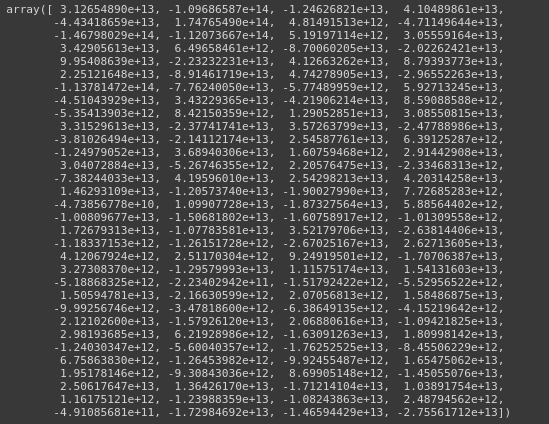
Covariance Matrix.
(4) Describe
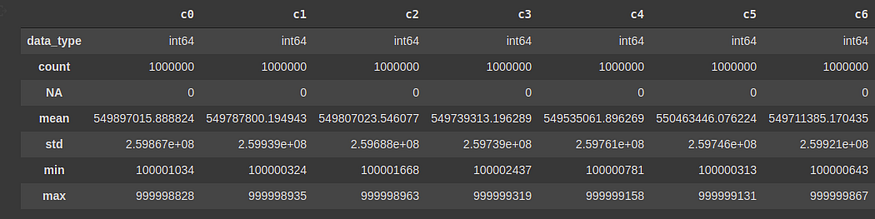
Just like pandas, the describe function gives a statistical description of the dataset, including the count, mean, standard deviation, minimum and maximum value.
vaex_df.describe()
Similarly, there are functions related to min, max, std, median, mode, min-max, and other important statistical functions, which you can explore in the documentation here.
(5) Groupby
Vaex can also do fast group-by aggregations. The output of it is a vaex DataFrame. Let's see an example.
gender = [‘male’,’male’,’female’,’male’,’female’]

weight = [95, 87, 74, 79, 65]

vaex_df = vaex.from_arrays(gender=gender, weight=weight)
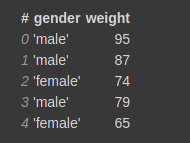
vaex_df
Now you can perform GroupBy operations on it.
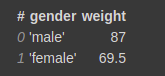
vaex_df.groupby(by=’gender’).agg({‘weight’:‘mean’})
This will group by on gender column and calculate the aggregation function mean on the weight column.
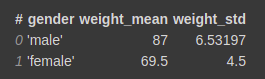
You can pass in multiple aggregate functions in a list for a single column. It will automatically give appropriate names to the resulting columns.
vaex_df.groupby(by=’gender’).agg({‘weight’:[‘mean’,’std’]})
Important Functions related to Data Cleaning
(1) Filling Missing Data
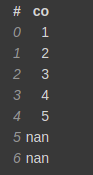
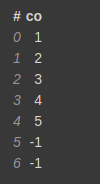
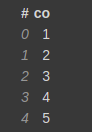
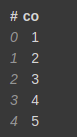
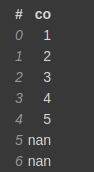
Let's create a small dataset to demonstrate this function.
test = [1,2,3,4,5,np.nan,np.nan]

test_df = vaex.from_arrays(co=test)
You can pass in any value in fillna to fill nan values with that value.
test_df.fillna(-1)
Notice that it is not in-place filling, so you might need to work on it. Another important thing is that no copy of the underlying data is made, but only a view/reference is made. The original columns will be renamed, and by default, they will be hidden columns. No data is lost.
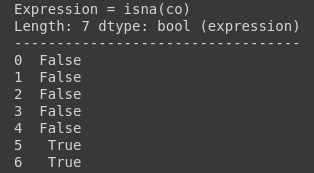
(2) Missing Data Information
You can use ismissing(), isna(), and isnan() functions for the information about missing data. The first function returns true where there are missing values (masked arrays), missing strings, or None. The second function returns a boolean expression indicating if the values are Not Available (missing or NaN). The third function returns an array where there are NaN values.
test_df.co.isna()
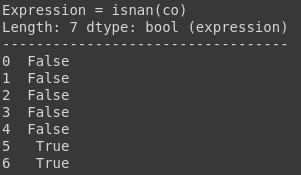
test_df.co.isnan()
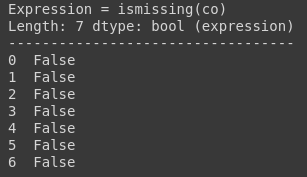
test_df.co.ismissing()
(3) Dropping Missing Data
You can drop missing data using dropna(), dropnan(), dropmissing(), and dropinf(). All of these functions perform similar tasks but they drop by using different functions. For example, dropmissing() function drops values uses ismissing filter function, and dropna() drops using the isna() filter function.
test_df.dropna()
test_df.dropnan()
test_df.dropmissing()
Notice that it will return a shallow copy of the original dataframe.
(4) Drop Columns
You can drop the columns in a vaex dataframe using the drop function.
vaex_df.drop(‘c0’)
You can pass in a single column or a list of the columns. It is also not in place, and you have to check the parameter. If the column is used in a virtual column, you can simply just True the check parameter, and it will hide it.
String Operations
Vaex has a separate class for string functions vaex.expression.StringOperations. To use these in your dataset, let's say you want to use it on a string column. All you have to do is to call df.str.reqFunction() this will apply that function on every row.
Let's create a new testing dataframe to demonstrate the string functions.
import vaex
text = [‘Testing’, ‘lowercase’, ‘UPPERCASE’, ‘test_example’]
df = vaex.from_arrays(text=text)
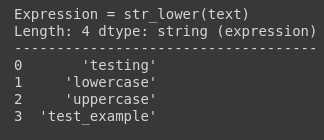
(1) Lower
This function converts all the uppercase characters to lowercase characters.
df.text.str.lower()
(2) Contains
This is an important function that takes in a keyword argument pattern, which can be a string to search in all rows or a regex pattern.
df.text.str.contains(pattern=’([A-Z])’, regex=True)
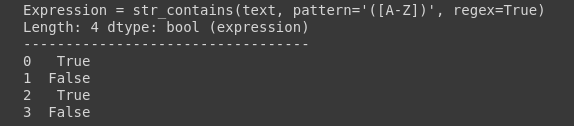
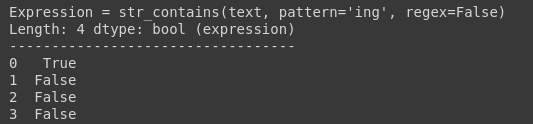
It has returned True for all the rows that contain the matched regex. Alternatively, you can search only a single string.
df.text.str.contains(pattern=’ing’, regex=False)
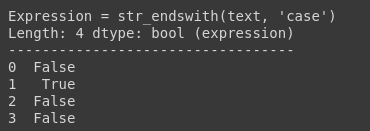
(3) Endswith
This function is used to check if the given strings end with the specific pattern or not. This pattern can be string or regex.
df.text.str.endswith(‘case’)
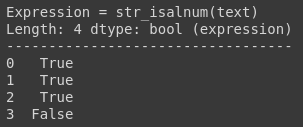
(4) Alpha Numeric Check
This function isalnum is used to check if all the characters in the string are alphanumeric or not. In our case, our last row has an underscore which is not an alphanumeric character.
df.text.str.isalnum()
There are a lot of other functions which you can explore in the official documentation.
Functions related to plotting
Vaex can quickly visualize a huge amount of dataset in no time. Most of the plots are done in 1 or 2 dimensions, and vaex can full fill most of the use cases.
The simplest 1D plot can be shown using
vaex_df.plot1d(vaex_df.c0)
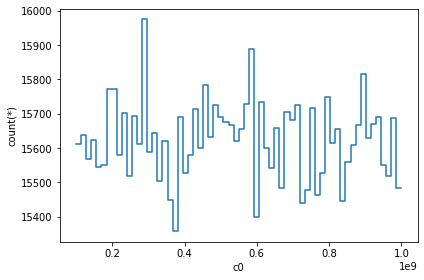
When only given 1 argument i.e., column name, it will show the histogram of that column. We can do some complex visualization, that is to not plot the counts, but to use some other bin. In most cases, passing the what='<statistic>(<expression>) where <statistic> is from one of the statistics methods mentioned in the API docs.
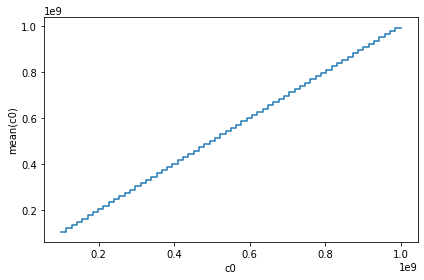
vaex_df.plot1d(vaex_df.c0, what=’mean(c0)’)
Similarly for 2D plotting, you can use
vaex_df.plot(vaex_df.c0, vaex_df.c1
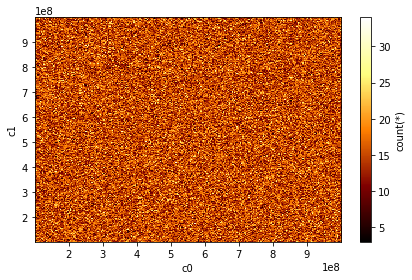
You can explore other graphs and graph types in the official documentation.
Virtual Columns
Another important feature of Vaex is the virtual columns. Sometimes, any expression is stored as a column, and it is convenient to do so. Vaex gives virtual columns, which do not take any memory and are computed on the fly when needed. This virtual column is treated as the normal column.
Let’s create a dummy dataset.
_rows = 10

n_cols = 2

data=np.random.randint(100000000, 1000000000, size=(n_rows, n_cols))
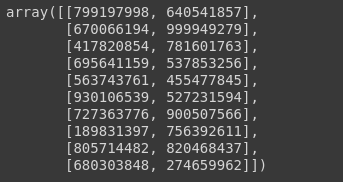 data numpy array
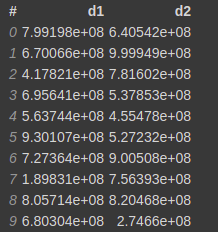
df = vaex.from_arrays(d1=data[:, 0], d2=data[:, 1])
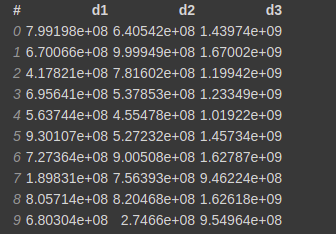
Now let's say you want to create another column d3 that is the sum of d1 and d2 columns. You can do
df['d3'] = df.d1+df.d2
This will create a virtual column d3 that is calculated on the run time when needed and will not occupy any memory.
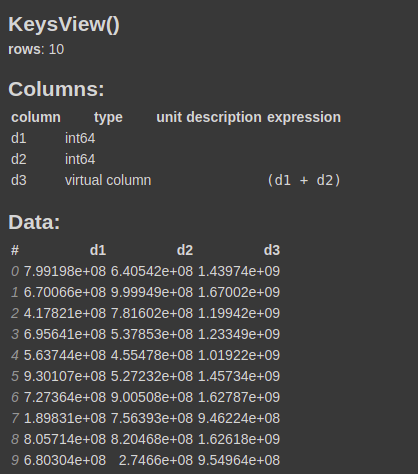
You can confirm it by calling the info function on the dataframe.
df.info()
Important Note
If you are using Google Colab to use vaex, you might end up with an old IPython version error, so you need to update the IPython via the following command in the cell.
!pip install ipython -U
Then you need to restart the runtime.
Ending Notes
In this article, you learned the basics of Vaex, which is a Python library used for the fast processing of big data and can be a good alternative to Pandas, especially for large datasets. Vaex has a lot of other functions and features, so I would definitely recommend checking out the official documentation.
Related: