Data Science For Business: 3 Reasons You Need To Learn The Expected Value Framework
This article highlights the importance of learning the expected value framework in data science, covering classification, maximization and testing.
By Matt Dancho.
One of the most difficult and most critical parts of implementing data science in business is quantifying the return-on-investment or ROI. In this article, we highlight three reasons you need to learn the Expected Value Framework, a framework that connects the machine learning classification model to ROI. Further, we’ll point you to a new video we released on the Expected Value Framework: Modeling Employee Churn With H2O that was recently taught as part of our flagship course: Data Science For Business (DS4B 201). The video serves as an overview of the steps involved in calculating ROI from reducing employee churn with H2O, tying the key H2O functions to the process. Last, we’ll go over some Expected Value Framework FAQ’s that are commonly asked in relation to applying Expected Value to machine learning classification problems in business.
3 REASONS YOU NEED TO LEARN THE EXPECTED VALUE FRAMEWORK
Here are the 3 reasons you need to know about Expected Value if you want to tie data science to ROI for a machine learning classifier. We’ll use examples from the DS4B 201 course that are related to employee churn (also called employee turnover or employee attrition).
REASON #1: CLASSIFICATION MACHINE LEARNING ALGORITHMS OFTEN MAXIMIZE THE WRONG METRIC
F1 is the threshold that harmonically balances the precision and recall (in other words, it optimally aims to reduce both the false positives and the false negatives finding a threshold that achieves a relative balance). The problem is that, in business, the costs associated with false positives (Type 1 Errors) and false negatives (Type 2 Errors) are rarely equal. In fact, in many cases false negatives are much more costly ( by a factor of 3 to 1 or more!).
EXAMPLE: COST OF TYPE 1 AND TYPE 2 ERRORS FOR EMPLOYEE ATTRITION
We develop a prediction algorithm that finds employees are 5X more likely when work too much overtime.

Calculating Expected Attrition Cost From H2O + LIME Results
REASON #2: the solution is Maximizing for Expected Value
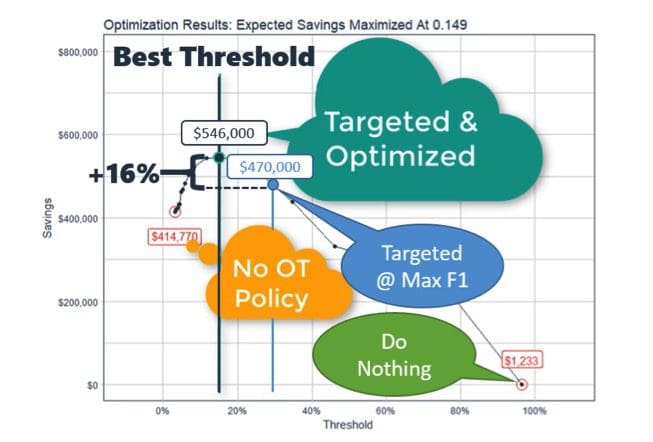
When we have a calculation to determine the expected value using business costs, we can perform the calculation iteratively to find the optimal threshold that maximizes the expected profit or savings of the business problem. By iteratively calculating the savings generated at different thresholds, we can see which threshold optimizes the targeting approach.
In the detailed example, we can see in the threshold optimization results that the maximum savings ($546K) occurs at a threshold of 0.149, which is 16% more savings than the savings at threshold at max F1 ($470K). It’s worth mentioning that the threshold that maximizes F1 was 0.280, and that for a test set containing 15% of the total population it cost $76K due to being sub-optimal ($546K - $470K). Extending this inefficiency to the full population (train + test data), this is a missed opportunity of $500K annually!
However, the model is based on a number of assumptions including the average overtime percentage, the anticipated net profit per employee, and so on.
REASON #3: Expected value CAN TEST for VARIABILITY IN ASSUMPTIONS
We can use Sensitivity Analysis along with Expected Value. We test the effect of model assumptions on expected profit (or savings) of an employee quitting
In the human resources example below, we tested for a range of values average overtime percentage and net revenue per employee because our estimates for the future may be off. In the Sensitivity Analysis Results shown below, we can see in the profitability heat map that as long as the average overtime percentage is less than or equal to 25%, implementing a targeted overtime policy saves the organization money.

Sensitivity Analysis Results (Profitability Heat Map)
Wow! Not only can we test for the optimal threshold that maximizes the business case, we can use expected value to test for a range of inputs that are variable from year to year and person to person. If you’re interested in learning how to apply the expected value framework for your business, we show you how, provide code, and show you other industries where this may apply in our as one of several examples in the Data Science For Business (DS4B 201 course).
Bio: Matt Dancho is a Data-Driven Decision Maker. Passionate about learning new tools, building software and working with people to gain insights and make better decisions. Enjoys working with teams and individuals to fuel operational excellence. Based in State College, PA, USA.
Related: