The Whole Data Science World in Your Hands
Testing MatrixDS capabilities on different languages and tools: Python, R and Julia. If you work with data you have to check this out.

I’ve been looking for years for a platform where I can run my data science projects without the pain of installations and filling my computer with dozens of different tools and environments.
Luckily I found that MatrixDS has all of that and more for free! In this article I’ll be testing almost all the tools they have so you don’t have to.
The project is public in the platform, you can see it here:
MatrixDS | The Data Project Workbench
MatrixDS is a place to build, share and manage data projects at any scale.community.platform.matrixds.com

If you want to test it out, what you hav to do is forklift it and that’s it.
There’s also a GitHub repo:
FavioVazquez/matrix_languages_tools
Testing different tools and languages of MatrixDS. Contribute to FavioVazquez/matrix_languages_tools development by…github.com
Testing Python things

Jupyter Notebook

My favorite programming language of the moment is Python. There are lots of great tools and features that can help you using this language. One of the most popular ones is Jupyter Notebook. To launch a notebook in MatrixDS do this:
- Go to the Tools tab in the platform.
- Click on the (+) button on the right hand side:

- Choose Python 3 (or 2) with Jupyter Notebook:

- Choose a name for the tool and set the number of cores and RAM:
- When the notebook is created and started then just open it:
- Have fun programming ;)
Inside of the notebook you are free to do whatever you want. I created a simple Python notebook to test PySnooper so you can try.


Here’s a gist of that notebook, that you can find in the MatrixDS project:
pysnooper
Jupyter Lab

JupyterLab is the next-generation web-based user interface for Project Jupyter. It’s like Jupyter Notebooks on steroids.
To launch a notebook in MatrixDS do this:
- Go to the Tools tab in the platform.
- Click on the (+) button on the right hand side:
- Choose Python 3 with JupyterLab:
- Choose a name for the tool and set the number of cores and RAM:
- When the tool is created and started then just open it:
- Have more fun :)
I created a simple Python Notebook in the JupyterLab instance to test so you can try.If you’ve been following me so far this is what you should be seeing:


Oh by the way if you want to know how to use git with MatrixDS check this article:
Data Science with Optimus. Part 2: Setting your DataOps Environment.
Breaking down data science with Python, Spark and Optimus. Today: Data Operations for Data Science. ..::Part 1 here…towardsdatascience.com
The test notebook I created tests the new library fklearn for functional machine learning. Here’s a gist of that notebook, that you can find in the MatrixDS project:
fklearn
Testing R things

I started my data science career on R. It’s a great tool for doing data analysis, data cleaning, plotting and much more. I think right now the machine learning part it’s better with Python, but to be a successful data scientist you need to know them both.
To launch RStudio in MatrixDS do this:
- Go to the Tools tab in the platform.
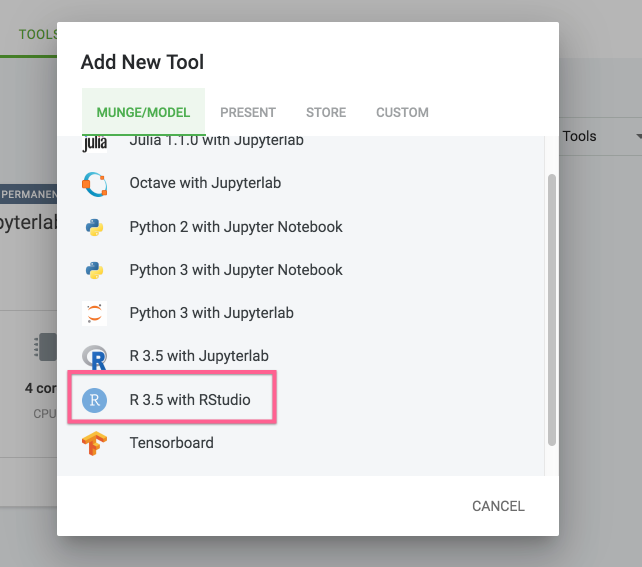
- Click on the (+) button on the right hand side:
- Choose R 3.5 with RStudio:
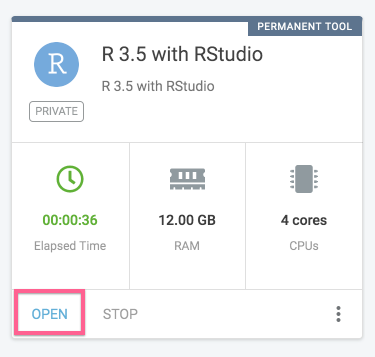
- Choose a name for the tool and set the number of cores and RAM:
- When the tool is created and started then just open it:
- Have R fun :)
The test R environment I created is testing the new library caalled g2r that creates graphics for interactive visualizations using g2.

Btw! I had to do this before running g2r:
sudo su
apt-get install libv8-dev
So, normally this is what you do for getting a plot with ggplot2:
library(ggplot2)

ggplot(iris, aes(Petal.Length, Petal.Width, color = Species)) +
  geom_point() +
  facet_wrap(.~Species)
And you will get:

Not so bad, but what about bringing interactivity to that?? With g2r it’s very easy. This is the code for doing that:
library(g2r)

g2(iris, asp(Petal.Length, Petal.Width, color = Species)) %>%
  fig_point() %>%
  plane_wrap(planes(Species))
And you’ll get:

In the code you change:
aes -> asp
geom_point() -> fig_point()
facet_wrap(.~Species) -> plane_wrap(planes(Species))
I’m still wondering why they didn’t use the same API but’s it’s a very cool project. There are more examples you can check out here:
Articles
Get up and running with g2r, discover the similarities with ggplot2 and a few examples to point you in the right…g2r.dev
This is all the code:
install.packages("remotes")
remotes::install_github("JohnCoene/g2r")

# So normally this is what you do for getting a plot with ggplot2

library(ggplot2)

ggplot(iris, aes(Petal.Length, Petal.Width, color = Species)) +
  geom_point() +
  facet_wrap(.~Species)

# Now with g2r

library(g2r)

g2(iris, asp(Petal.Length, Petal.Width, color = Species)) %>%
  fig_point() %>%
plane_wrap(planes(Species))
Testing Julia things

When I was studying my masters in Physics (like 2 years ago) I really thought that Julia was going to revolutionize the scientific programming world. Don’t get me wrong, it’s doing an amazing job, but I think new advancements with Python has left the project in second place for so many things.
For testing the Julia capabilities of MatrixDS I wanted to take a look at the data libraries of the language. And you can see that below.
To launch a Julia Notebook in MatrixDS do this:
- Go to the Tools tab in the platform.
- Click on the (+) button on the right hand side:
- Choose Julia 1.1.0 with JupyterLab:
- Choose a name for the tool and set the number of cores and RAM:
- When the tool is created and started then just open it:
- Let’s Julia :) (sounds weird)
When you launch it, you can open or create any Python or Julia notebook:


This is the notebook I created for testing Julia capabilities for data science:
Here I tested some libraries like DataFrames, Gadfly, Queryverse, Vega for plotting and more :)
So as you can see, this for me is the more complete platform for doing data science in the cloud. You need minimum configuration and you can even install your own tools with docker.
There’s much more to cover and things to do with the platform, and I’ll be doing that in other articles. If you want to be in touch with me follow me here:
Favio Vázquez (@FavioVaz) | Twitter
The latest Tweets from Favio Vázquez (@FavioVaz). Data Scientist. Physicist and computational engineer. I have a…twitter.com
Bio: Favio Vazquez is a physicist and computer engineer working on Data Science and Computational Cosmology. He has a passion for science, philosophy, programming, and music. He is the creator of Ciencia y Datos, a Data Science publication in Spanish. He loves new challenges, working with a good team and having interesting problems to solve. He is part of Apache Spark collaboration, helping in MLlib, Core and the Documentation. He loves applying his knowledge and expertise in science, data analysis, visualization, and automatic learning to help the world become a better place.
Original. Reposted with permission.
Related:
- Top Machine Learning Projects for Julia
- Best Practices for Using Notebooks for Data Science
- Running R and Python in Jupyter