Null Hypothesis Significance Testing is Still Useful
Even in the aftermath of the replication crisis, statistical significance lingers as an important concept for Data Scientists to understand.

There are many types of statistical tests — null hypothesis significance testing predominates.
With this technique, the objective is to test an observation against the null hypothesis. You can think of the null hypothesis as the status quo. It represents the situation where the intervention does not work.
Significance testing rose to preeminence because it is a useful way to draw inference over a subset of data drawn from a larger population. This article will enhance your intuition about this useful data science technique.
Overview
The goal of the researcher conducting the null hypothesis test is to evaluate whether or not the null hypothesis can be rejected. This requires a probability threshold called the significance level or alpha (⍺). This value, typically set at 0.05, represents the level of evidence needed to reject the null hypothesis that the intervention has no effect.
A significance level of 0.05 means that if we run the test 100 times, we can expect to incorrectly reject the null hypothesis 5 times out of 100. In other words, 5% of the time we are incorrectly reporting that the intervention has an impact when there is no actual effect.
To make a test more rigorous, a researcher would simply decrease alpha from the standard 0.05 to a value of 0.01 or below. Different scientific disciplines have different standards for setting alpha. In particle physics, where measurements are very precise, alpha might be set at 0.000001. In the social sciences, by contrast, alpha of 0.05 is considered acceptable.
Rejecting the null hypothesis
Hypothesis testing results in the calculation of the p-value. Before I define this term, please go watch this video of a bunch of statisticians attempting to do so:
So, what's a P-Value?
P-values are really important in scientific research. But do scientists even know what they are?
Welcome back, heavy-hearted traveler into the bizarro land exposed by Nate Silver and team. Do you still want a definition of p-value?
Okay, fine:
Probability of getting results at least as extreme as the results observed, given that the null hypothesis is correct.
As a further explanation from researcher Stuart Buck:
The p-value won’t tell you whether the coin is fair, but it will tell you the probability that you’d get at least as many heads as you did if the coin was fair.
With these technical and functional definitions in mind, let’s move along to understanding how the p-value is used in significance testing.
A p-value less than or equal to alpha indicates that we can reject the null hypothesis and say that the result is statistically significant. In this case, the evidence is in favor of the alternative hypothesis — though we would never say that we accept the alternative hypothesis ️️⛔️
Nope. Thanks to statistics, we’re stuck with the clunky double negative: we reject the null hypothesis ✅
This is in fact very important because in science it is essentially impossible to prove that an intervention is effective. Think back to your 3rd grade science teacher explaining that gravity is just a theory — no matter how many times you knock your books off the desk, you can’t conclusively prove the alternative hypothesis that gravity works and will always make your books fall.
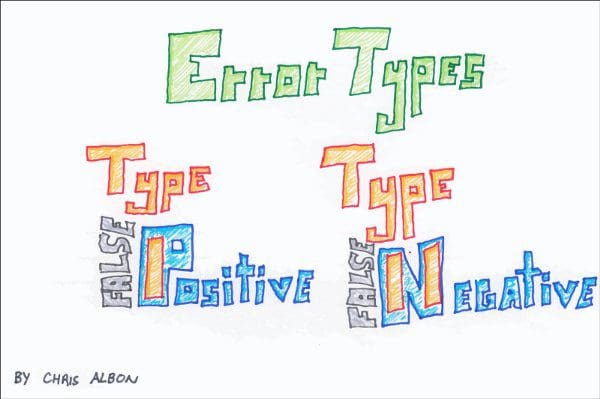
When we perform null hypothesis significance testing, there are two potential errors we could make when evaluating the null hypothesis. If the null hypothesis is wrongly rejected (i.e. we think the vaccine is effective, when in fact it is not), we’ve committed a Type 1 error — a false positive. Conversely, if we fail to reject null hypothesis, when in fact we should (i.e. we think the vaccine is not effective, when in fact it is), we’ve committed a Type 2 error — a false negative.
Chris Albon has created a handy graphic to help us tell the difference:
Significance testing vocabulary
- Hypothesis: statement that is testable on the basis of observed data
- Null hypothesis: default hypothesis that the effect to be measured is equal to zero
- Significance level (⍺): threshold set by the researcher that represents the probability of rejecting the null hypothesis when it is true
- p-value: the probability under a specified statistical model that a statistical summary of the data (for example, the sample mean difference between two compared groups) would be equal to or more extreme than its observed value; if p ≤ ⍺, we can reject the null hypothesis and say the results are statistically significant
- Alternative hypothesis: the opposite of the null hypothesis
- Type 1 error: rejecting the null hypothesis when it is in fact true; also called false positive
- Type 2 error: failing to reject the null hypothesis when it is in fact false; also false negative
A caveat about significance testing
Note that the methodology of null hypothesis significance testing has come under fire for a number of reasons:
???? First, p-values are notoriously difficult to explain. It’s tricky to base foundational concepts of the scientific method on concepts that experts struggle to articulate and the general populace has trouble understanding.
???? Second, as alluded to in the description of this post, p-values played a role in the replication crisis that shook the social sciences in the mid-2010s. The term p-hacking refers to the practice of manipulating the data or analysis until the p-value conforms to the required less-than-alpha level for statistical significance. The Reproducibility Project, brainchild of psychologist Brian Nosek, revealed that only 36% of 100 evaluated psychology findings resulted in statistically significant results when replicated.
???? Third, good alternatives to null hypothesis significance testing exist, and include: effect size, confidence intervals, and somewhat precise outcome testing (SPOT).
Summary
To close, here’s a quote from Annie Duke, poker champ and author of Thinking in Bets:
Despite the popular wisdom that we achieve success through positive visualization, it turns out that incorporating negative visualization makes us more likely to achieve our goals.
In life as in data science, it’s useful to work from the assumption that our model won’t work, our intervention won’t have an effect, the status quo won’t be disrupted by new events.
Null hypothesis significance testing starts with that premise and challenges the researcher to find sufficient evidence to reject the status quo. Though mostly hated, significance testing is still a useful methodology for data scientists to understand.
More articles to advance your data science
Comprehensive Guide to the Normal Distribution
Drop in for some tips on how this fundamental statistics concept can improve your data science.
How to Use Clustering to Create a Neighborhood Explorer Tool
A step-by-step walkthrough of using sklearn’s clustering algorithm to create an interactive dashboard for your city.
Data Science for the New Normal — Lessons from a $1.4B Startup
Post-COVID, machine learning is increasingly crucial for business success.
10 Python Skills They Don’t Teach in Bootcamp
Ascend to new heights in Data Science and Machine Learning with this list of coding tips.
Resources to Supercharge your Data Science in 2021
The tools you need to succeed with machine learning in the new year.
Bio: Nicole Janeway Bills is Data Scientist with experience in commercial and federal consulting. She helps organizations leverage their top asset: a simple and robust Data Strategy. Sign up for more of her writing.
Original. Reposted with permission.
Related:
- 6 Lessons Learned in 6 Months as a Data Scientist
- Demystifying Statistical Significance
- Comprehensive Guide to the Normal Distribution