 Applying Python’s Explode Function to Pandas DataFrames
 Applying Python’s Explode Function to Pandas DataFrames
Read this applied Python method to solve the issue of accessing column by date/ year using the Pandas library and functions lambda(), list(), map() & explode().
By Michael Mosesov, Data Analyst
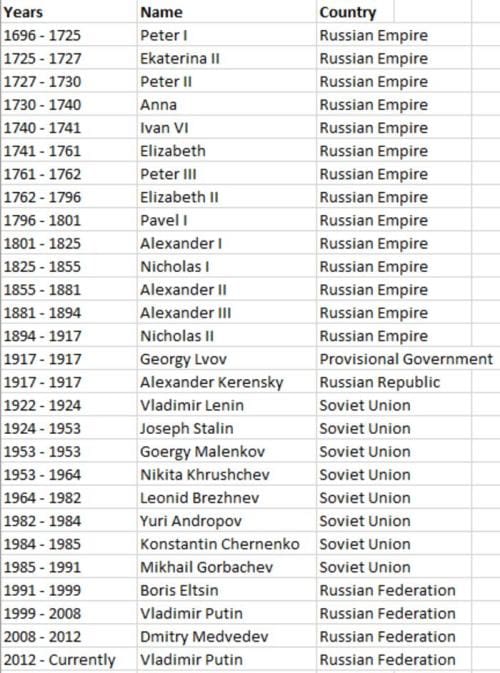
Initial csv file
In our case we would use a historical data set of Russian leaders since the foundation of the Russian Empire in 1696, particularly their names, abbreviation of the government and years in power. The aim would be to clone/explode the dataset, so that each governor could be accessed by the year. For example, the current dataset format would not display who was the leader in year 1700 if you try to access that row.
This could be solved by splaying the “Years” column by a hyphen (-) between two dates.
Our aim is to transform each element of a list-like to a row, while keeping the same index that was assigned by Python to each row.
P.s. There were about 5 years between 1917 and 1922 of civil war with no single official state.
P.s.s. The dataset was cut down to last approximately 300 years, there were more leaders of Russia since 862.
In the beginning, we import the Pandas library into the Jupyter Notebook and take a look at the first and last rows of our data. The first step of data manipulation process is to create a data frame using the pd.DataFrame:

Quick Jupyter Notebook exploratory data preview
The explode() function is used to transform each element of a list-like to a row, therefore our first task is to create a list, separated by commas, of the values in the “Years” column.
But before that, it is vital to make all values numerical inside the “Years” column. Based on the observation of the last row, we see that extra editing is required for Python to apply the explode function and splaying the years in the “Years” column, converting all of the values to numbers, which means to replace the “currently” with “2021”, as this is the year when the article is written.
Replacement of values in such cases could be done using the lambda() function and x.replace, as demonstrated in the code below it also works for all the values in data frame if you need to change it in many rows.

Lambda function assists in replacing values in data frames of any size and rows at any place
The next step is to split the dates in the “Years” column by a hyphen in order to expand/splay the data frame. The aim of the action, as been mentioned above, is to automatically splay and expand the hyphen between the two years. The following functions would help us to create lists of dates which is separated by a comma instead of hyphen:

Although those steps could be done separately, Python allows to fit them in one line of code
The following result should display after the manipulation with data frame:

After assuring that all of our values in rows of the “Years” column are in the format of lists, we can finally apply the explode function to the whole dataset.

Result of applied explode() function to the entire data frame
Now we are able to see the result of explode function which could be used in the cases such as the following when there is a need to splay and expand on column in your data frame and make it more accessible. The reset_index() could be applied in case there is a need for an extra index in addition to the one initially assigned one to the unique row. It is also vital to create a new “exploded” pd.DataFrame to save the results to data set in csv format:

Saving new, exploded data frame
In result of the explode() the dates in the “Years” column have splayed throughout the data set and now each year of governing by each leader represents a new row. Prior to that, functions such as lambda(), list() and map() allowed us to save time and automatically expand the values (in our case years) between the dates. Such approach is useful when manipulating with dates and can be easily applied to small or large datasets in any field.
Below is the preview of exported data set in csv. While initial “index” was left assigned to each unique value (from splayed “Years”), there is an added index on the left for each of 348 rows:

Preview of the final edited version
Bio: Michael Mosesov is a Data Analyst located in Russia.
Original. Reposted with permission.
Related:
- A Simple Way to Time Code in Python
- How to Speed Up Pandas with Modin
- 11 Essential Code Blocks for Complete EDA (Exploratory Data Analysis)