A Faster Way to Prepare Time-Series Data with the AI & Analytics Engine
Many real-world datasets consist of records of events that occur at arbitrary and irregular intervals. These datasets then need to be processed into regular time series for further analysis. We will use the AI & Analytics Engine to illustrate how you can prepare your time-series data in just 1 step.
Introduction
Time-series analysis and prediction often require data equally spaced in time. Many real-world datasets, however, consist of records of events that occur at arbitrary and irregular intervals. These datasets then need to be processed into regular time series for further analysis.
Dataset
We will use the AI & Analytics Engine to illustrate how you can prepare your time-series data in just 1 step. Let’s upload the Online Judge Server Log dataset from Kaggle and start a recipe of data wrangling actions in the Engine.
Suppose our objective is to explore the number of distinct URLs every hour. To achieve this, we need to deal with the following three issues that we observed in the dataset:
- There are some rows with duplicates in the time-index column but have different values in other columns;
- The time-index column is unnecessarily fine-grained (with precision in seconds);
- The time-index column is not equally spaced.
Resampling Time Series
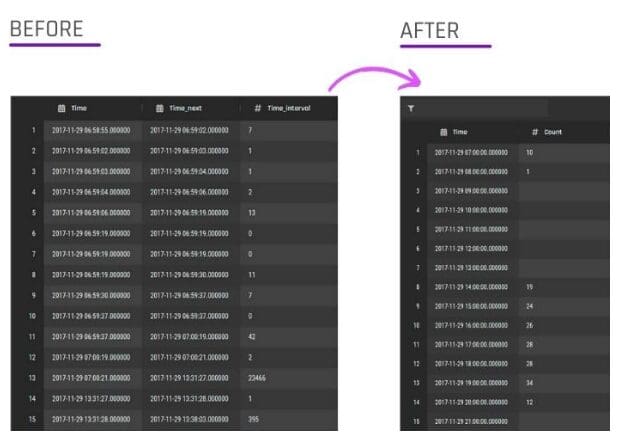
To resolve these issues, we need to reset the time-index column with an equally-spaced interval at an appropriate precision level. To achieve this, the Engine offers a Resampling Data into a Regular Time Series action in the recipe-editor catalogue.
In general, we can conveniently set a time interval to be any value, for example, 15 minutes. Once the action is added, the preview on the left is automatically updated, along with a short summary of the list of queued actions. As you can see below, with 1 step, the dataset is now a regular time series of 1-hour intervals.
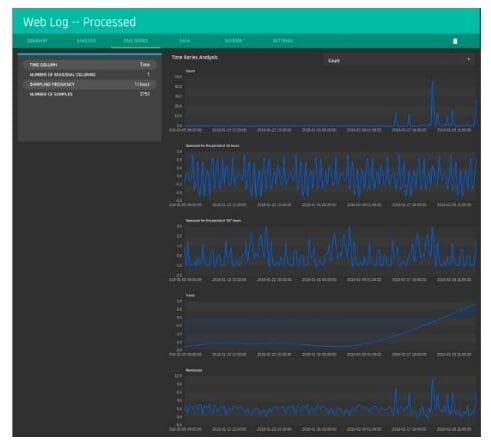
Once the recipe is finalized, we can use the processed dataset for a broad range of analytical and modelling methods. One such method is the STL decomposition, which breaks down the time series into seasonal, trend, and remainder components. Once the dataset is processed into a regular time series and the recipe is finalized, this is automatically computed by the Engine and shown on the dataset’s page. For this dataset, we can clearly see a visualization of trend and seasonality as shown below:
Wrap-up
Using PI.EXCHANGE’s AI & Analytics Engine, you can prepare time-series data in just 1 data wrangling step. The Engine provides an unlimited set of possible ways to do this, by offering a flexible way to specify the sampling interval and the aggregation functions. With this, we can easily prepare our time-series data in any way we see fit. Trial free for 2 weeks!