From Scratch: Permutation Feature Importance for ML Interpretability
Use permutation feature importance to discover which features in your dataset are useful for prediction — implemented from scratch in Python.
By Seth Billiau, Data Scientist and Statistician

Photo by Arno Senoner on Unsplash
Introduction
Advanced topics in machine learning are dominated by black box models. As the name suggests, black box models are complex models where it’s extremely hard to understand how model inputs are combined to make predictions. Deep learning models like artificial neural networks and ensemble models like random forests, gradient boosting learners, and model stacking are examples of black box models that yield remarkably accurate predictions in a variety of domains from urban planning to computer vision.
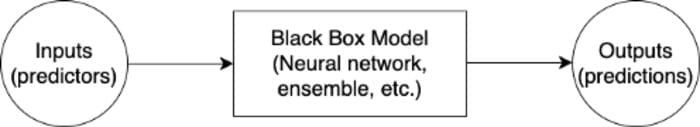
Diagram of a Black Box Model
However, one drawback to using these black box models is that it’s often difficult to interpret how predictors influence the predictions — especially with conventional statistical methods. This article will explain an alternative way to interpret black box models called permutation feature importance. Permutation feature importance is a powerful tool that allows us to detect which features in our dataset have predictive power regardless of what model we’re using.
We will begin by discussing the differences between traditional statistical inference and feature importance to motivate the need for permutation feature importance. Then, we’ll explain permutation feature importance and implement it from scratch to discover which predictors are important for predicting house prices in Blotchville. We’ll conclude by discussing some drawbacks to this approach and introducing some packages that can help us with permutation feature importance in the future.
Statistical Inference vs. Feature Importance
When using traditional, parametric statistical models, we can rely on statistical inference to make precise statements about how our inputs relate to our outputs. When we use linear regression, for example, we know that a one-unit change in our predictor corresponds to a linear change in our output. The magnitude of that change is estimated during model fitting and we can provide uncertainty measures for these estimates using probability theory.

Photo by Javier Allegue Barros on Upsplash
Unfortunately, it’s often impossible for us to make these kinds of statements when using a black box model. A deep neural network likely has hundreds, thousands, or even millions of trainable weights that connect the input predictors to the output predictions (ResNet-50 has over 23 million trainable parameters) along with several non-linear activation functions. When dealing with a model this complex, it becomes extremely challenging to map out the relationship between predictor and prediction analytically.
Feature importance techniques were developed to help assuage this interpretability crisis. Feature importance techniques assign a score to each predictor based on its ability to improve predictions. This allows us to rank the predictors in our model based on their relative predictive power.
One method for generating these feature importance scores is by leveraging the power of random permutations. The next section explains how to perform permutation feature importance using python.
Permutation Feature Importance
The idea behind feature importance is simple. Inputs that are useful for prediction contain valuable information. If you destroy that information by randomly shuffling the feature values, the quality of your predictions should decrease. If the decrease in quality is small, then the information in the original predictor wasn’t very impactful in determining your predictions — your model is still pretty good without it. Furthermore, if the decrease is large, then the information in the original predictor had a large impact on your predictions.
This idea is implemented in three simple steps. Say that you’ve trained an ML model and recorded some measure of quality for the predictions (ex. MSE, log-loss, etc). For each predictor in the dataset:
- Randomly shuffle the data in the predictor while keeping the values of other predictors constant
- Generate new predictions based on the shuffled values and evaluate the quality of your new predictions
- Compute the feature importance score by calculating the decrease in the quality of your new predictions relative to your original predictions
Once you’ve computed feature importance scores for all of your features, you can rank them in terms of predictive usefulness. To help explain permutation feature importance more concretely, consider the following synthetic case study.
Case Study: Predicting House Prices
Note: Code is included when most instructive. Follow along with the full code for this guide here.
Suppose that the prices of 10,000 houses in Blotchville are determined by four factors: house color, neighborhood density score, neighborhood crime rate score, and the neighborhood education score. Houses in Blotchville are either red or blue, so color is encoded as a binary indicator. The three quantitative scores are standardized and approximately normally distributed. The price of house i can be determined from these factors according to the following data-generating equation:

Data Generating Equation
The dataset also contains five other predictors that are uncorrelated with the price of houses and have no predictive power. Here’s a snapshot of the first five rows of the dataset, df.
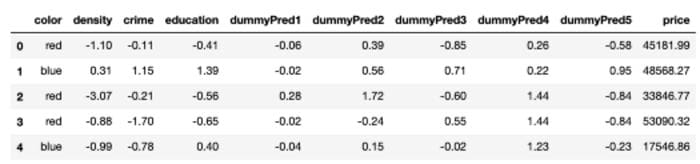
Snapshot of the Dataset
Say that we want to train a model to predict price from the other nine predictors. We could use any black box model, but for the sake of this example, let’s train a random forest regressor. To do this, we split our data into a train and test dataset. Then, we use sklearn to fit a simple random forest model.
from sklearn.model_selection import train_test_split
from sklearn.ensemble import RandomForestRegressorX = df.drop(columns = 'price')
# One-hot encode color for sklearn
X['color'] = (X['color'] == 'red')
y = df.price# Train Test Split
X_train, X_test, y_train, y_test = train_test_split(X, y,
                                                    test_size=0.33,
                                                    random_state=42)# Instantiate a Random Forest Regressor
regr = RandomForestRegressor(max_depth=100, random_state=0)# Fit a random forest regressor
regr.fit(X_train, y_train)
At this point, feel free to take some time to tune the hyperparameters of your random forest regressor. But, since this isn’t a guide on hyperparameter tuning, I am going to continue with this naive random forest model — it’ll be fine for illustrating the usefulness of permutation feature importance.
One commonly-used metric to assess the quality of regression predictions is root mean squared error (RMSE) evaluated onthe test set. Let’s calculate the RMSE of our model predictions and store it as rmse_full_mod.
from sklearn.metrics import mean_squared_errorrmse_full_mod = mean_squared_error(regr.predict(X_test), y_test, squared = False)Now, we can implement permutation feature importance by shuffling each predictor and recording the increase in RMSE. This will allow us to assess which predictors are useful for making predictions. Here’s the code to do this from scratch. See if you can match up the comments of this code to our algorithm from earlier.
# Initialize a list of results
results = []# Iterate through each predictor
for predictor in X_test:

    # Create a copy of X_test
    X_test_copy = X_test.copy()

    # Scramble the values of the given predictor
    X_test_copy[predictor] = X_test[predictor].sample(frac=1).values

    # Calculate the new RMSE
    new_rmse = mean_squared_error(regr.predict(X_test_copy), y_test,
                                  squared = False)

    # Append the increase in MSE to the list of results
    results.append({'pred': predictor,
                    'score': new_rmse - rmse_full_mod })# Convert to a pandas dataframe and rank the predictors by score
resultsdf = pd.DataFrame(results).sort_values(by = 'score',
                                              ascending = False)
The resulting dataframe contains permutation feature importance scores. Large scores correspond to large increases in RMSE — evidence of worse model performance when a predictor was shuffled. Upon inspection of the table, we see that the four data-generating predictors (education, color, density, and crime) have relatively large values, meaning that they have predictive power in our model. On the other hand, the five dummy predictors have relatively small values, meaning that they are not as useful for making predictions.
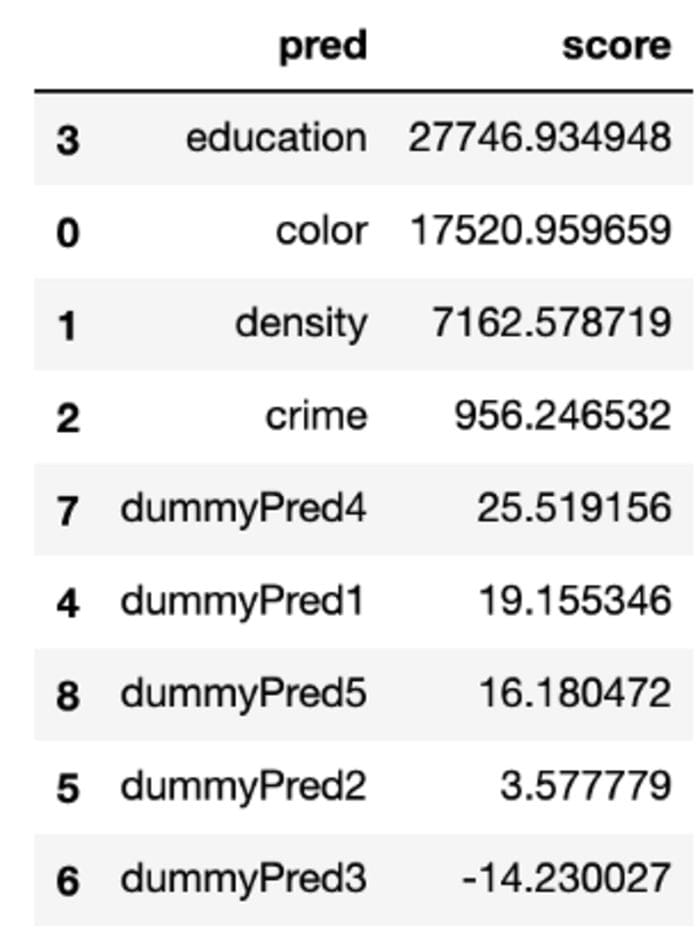
Results of Permutation Dataframe
We can graph our permutation feature importance scores as well for easier comparison using matplotlib.
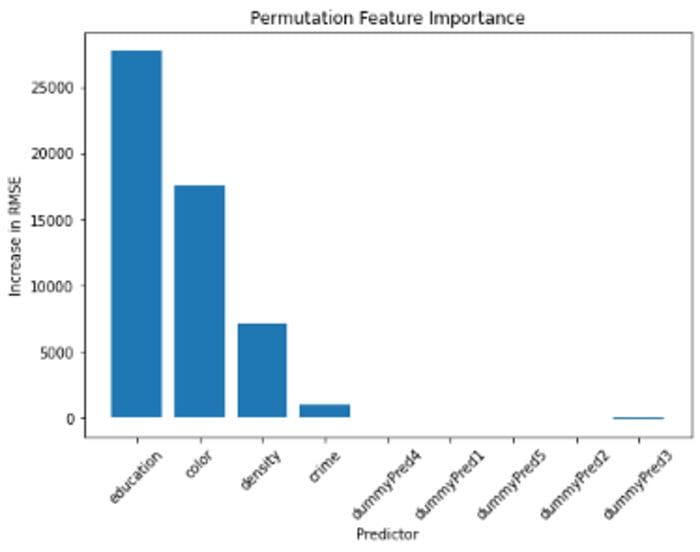
Permutation Feature Importance Plot
From this analysis, we gain valuable insights into how our model makes predictions. We see that education score is the predictor that offers the most valuable information when predicting house price in our model. House color, density score, and crime score also appear to be important predictors. Finally, it appears that the five dummy predictors do not have very much predictive power. In fact, since dropping dummy predictor 3 actually led to a decrease in RMSE, we might consider performing feature selection and removing these unimportant predictors in future analysis.
Drawbacks to Permutation Feature Importance

Photo by Martin Esteve on Upsplash
While we’ve seen the many benefits of permutation feature importance, it’s equally important to acknowledge its drawbacks (no pun intended). Here are a few disadvantages of using permutation feature importance:
- Computational Time: This process can be computationally expensive since it requires you to iterate through each of your predictors and make predictions. If it’s not cheap to make predictions or if you have many, many predictors, this could be costly.
- Poor Performance in the Presence of Multicollinearity: Permutation feature importance can perform poorly if your dataset has correlated features. If the information in one predictor is also stored in a correlated predictor, then the model may still perform well when one of those predictors is shuffled.
- Scores are relative, not absolute: Permutation importance scores show the relative predictive power of features in a model. However, these scores don’t really have any meaningful value out of context — any score could be really good or really bad depending on the other scores.
- Feature importance still isn’t statistical inference: Feature importance techniques can only tell you how useful a predictor is — they don’t give any insight into the nature of the relationship (ex. linear, quadratic, etc.) or the magnitude of the predictor’s effect. Permutation feature importance is not a replacement for statistical inference, but rather an alternative solution for when it’s impossible to perform traditional inference.
Conclusion
Permutation feature importance is a valuable tool to have in your toolbox for analyzing black box models and providing ML interpretability. With these tools, we can better understand the relationships between our predictors and our predictions and even perform more principled feature selection.
Though we implemented permutation feature importance from scratch, there are several packages that offer sophisticated implementations of permutation feature importance along with other model-agnostic methods. Python users should look into the eli5, alibi, scikit-learn, LIME, and rfpimp packages while R users turn to iml, DALEX, and vip.
Happy permuting! If you have any questions, feel free to leave a comment, and I’ll do my best to provide an answer.
Acknowledgments: A big thank you to the wonderful Claire Hoffman for proofreading and editing this article and putting up with my neglect of the Oxford comma. I’m also grateful to Leo Saenger for reading the article and providing his suggestions.
Bio: Seth Billiau is a Data Scientist and Statistician, A.B. in Statistics at Harvard University, Former Vice President of the Harvard College Open Data Project. Email: sethbilliau [at] college.harvard.edu
Original. Reposted with permission.
Related: